CitiBike Project
CitiBike

Objective
- Discover actionable insights for the business strategy team to help make informed decisions that will circumvent availability issues and ensure the company’s position as a leader in eco-friendly transportation solutions in the city.
Data
Tool
- Python libraries:
- Matplotlib, Seaborn, and Plotly to make charts,
- pandas and KeplerGl to create maps, and
- Streamlit to design the final dashboard.
Data Analysis
- Conduct a descriptive analysis of existing data, to understand user’s behavior to help the business strategy department assess the current logistics model of bike distribution across the city and identify expansion opportunities.
- All the necessary files for the analysis can be found on GitHub under the CitiBike repository.
Note:
- The final steps of the analysis display a random sample comprising 8% of the dataset.
- This is done to facilitate easier data manipulation and accommodate resource limitations.
CitiBike Strategy Dashboard
↦ This dashboard addresses the distribution challenges faced by New York CitiBike and identifies potential expansion opportunities.
↦ Currently, CitiBike encounters issues like insufficient bikes at popular stations and stations overcrowded with docked bikes, complicating the process of returning hired bikes. Additionally, customers often complain about bike unavailability at certain locations.
↦ This analysis seeks to pinpoint the root causes of these distribution problems, improve bike availability, and reinforce CitiBike’s role as a leader in eco-friendly transportation solutions in the city.
Bike Usage & Weather
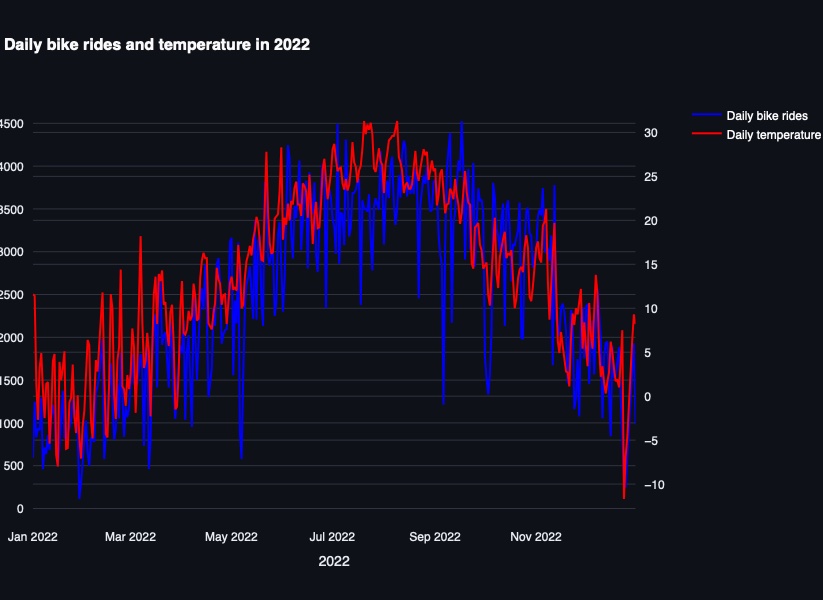
- There is a correlation between temperature changes and daily bike trip frequency.
- As temperature rises, bike usage increases, peaking between May and September.
- Conversely, during the colder months, usage decreases, with the lowest levels in January and February.
- This insight suggests that bike shortage may primarily occur in the warmer months, roughly from May to October.
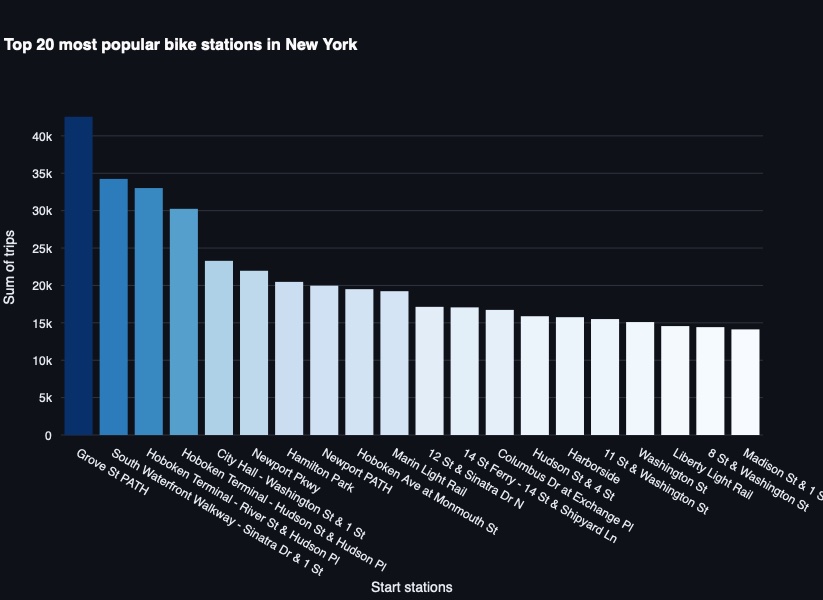
Most Popular Stations
↦ The bar chart shows that certain start stations are more popular than others.
↦ The top four popular stations are:
- Grove St Path
- South Waterfront Walkway
- Hoboken Terminal – River St & Hudson Pl
- Hoboken Terminal – Hudson St & Hudson Pl
↦ This indicates that bikes are more likely to be unavailable at these stations because of insufficient supply.
↦ This observation can be cross-referenced with the interactive map accessible via the sidebar select box.
Interactive Map with Aggregated Bike Trips
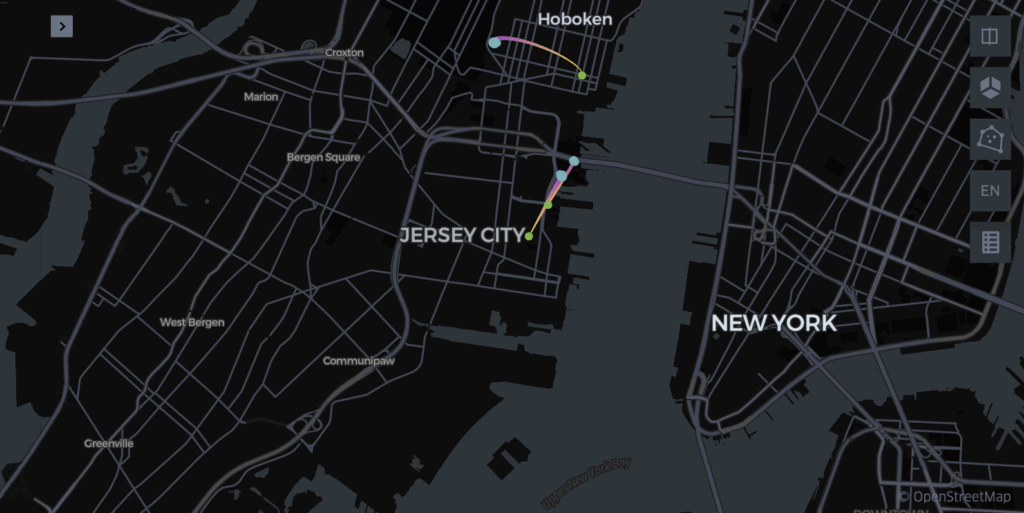
↦ With the filter on the left side of the map, we can check if the most popular start stations are also among the top frequented trips.
↦ The most popular route, with 999K trips, is from Marshall St & 2 St to City Hall station (Washington St & 1 St).
↦ Other frequently traveled routes, with over 990K trips, include those along the waterfront:
- Newport Pkwy to Washington S
- Newport Path to Warren St
↦ The most popular start stations are:
- Grove St Path, South Waterfront Walkway, and Hoboken Terminal (River St/Hudson Pl and Hudson St/Hudson Pl.
↦ With the aggregated bike trips filter enabled for Grove St Path, South Waterfront Walkway, and Hoboken Terminal (River St/Hudson Pl and Hudson St/Hudson Pl), the following observations can be made:
- Trips from Grove St Path and Hoboken Terminal (Hudson St & Hudson Pl) are within New Jersey and don’t include trips in New York City.
- Most trips from South Waterfront Walkway (Sinatra Dr & 1 St) and Hoboken Terminal (River St & Hudson Pl) are also within New Jersey, with a few extending into New York City.
- No trips begin in New York, though many end there, due to the limitations of the original dataset provided for this project.
Conclusions and Recommendations
Our analysis suggests that New York CitiBikes should prioritize the following objectives to tackle challenges at specific stations and fulfill customer needs:
↦ Expanding and increasing the number of stations along the waterfronts of New Jersey and New York can help resolve the current bike distribution issues.
↦ Specifically, it is strongly recommended to expand the stations at Marshall/City Hall, Newport Pkwy/Washington, and Newport Pkwy/Newport Path to Warren St, as these high-demand locations frequently face shortages at the start and challenges with bike returns at the end stations.
↦ Increase the number of stations in the Hoboken area, especially near the Hoboken train station and the Holland Tunnel on the New Jersey side. Additionally, add more stations on the New York side near City Hall, close to the Brooklyn Bridge.
↦ Additional stations are also recommended along the New Jersey waterfront, from Liberty State Park to the Lincoln Tunnel.
↦ It’s crucial to reallocate resources from less popular stations to areas with higher demand. During warmer months, ensure popular stations are fully stocked to meet increased demand, and consider reducing supply in colder months at less popular locations to minimize logistical costs.
↦ By focusing on these key New York CitiBike stations, we can alleviate distribution challenges, improve bike availability, and better meet customer needs and demands.
Note: The final steps of the analysis display a random sample comprising 8% of the dataset. This is done to facilitate easier data manipulation and accommodate resource limitations.
Data Visualization

