Databel Project
Customer Churn Analysis
PROBLEM |
- Databel is a telecommunications company facing a customer churn challenge.
- This analysis investigates the key factors and patterns driving churn rates to inform retention strategies.
Goal |
Understand the reasons and patterns behind customer churn and develop data-driven recommendations to reduce churn rates.
Role |
Data Analyst
Project Scale |
October 2025
Primary Stakeholder |
Databel Telecommunication Company
Datasets |
Databel Data
Case Study: Analyzing Customer Churn in Tableau | Data Analyst in Tableau | DataCamp
Tools Used |
Exploratory Analysis
Calculating Churn
Measure before the analysis
- Number of Churned Customers
- Churn Rate
Investigate Churn Reasons
- What the different reasons are for customers churned
- What the percent of customers for each reason
- Churn Category
Churn Rate per State
- Competitors launched promos in certain states, and Databel wants to find out if it had impact on their customers.
Key Findings
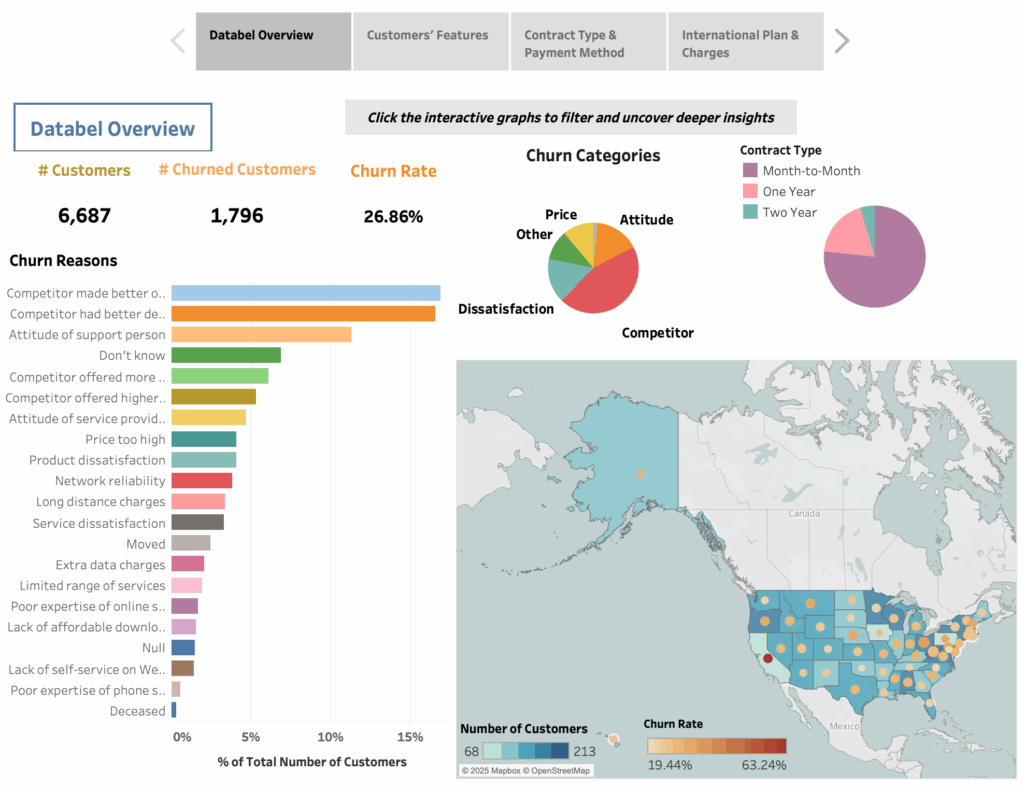
Over a quarter of Databel’s customers are churning, representing a significant loss that could substantially harm the company’s financial performance and reputation. For subscription-based businesses like Databel, reducing customer churn is a top priority.
- Churn Drivers: The two leading reasons customers are leaving (~16% each) are that competitors made better offers and competitors had better devices.
- Overall, competitor-related factors represent the top category for customer churn at Databel, followed by attitude issues and customer dissatisfaction.
Geographic Insights: Minnesota has the highest number of Databel customers (168 customers) with a churn rate of over 22%, while California shows the highest churn rate at over 63%, despite having the lowest customer base of only 68 customers. - Contract Type: The majority of Databel customers (64.29%) hold month-to-month contracts, which may contribute to the ease of churning.
Investigating Churn Patterns
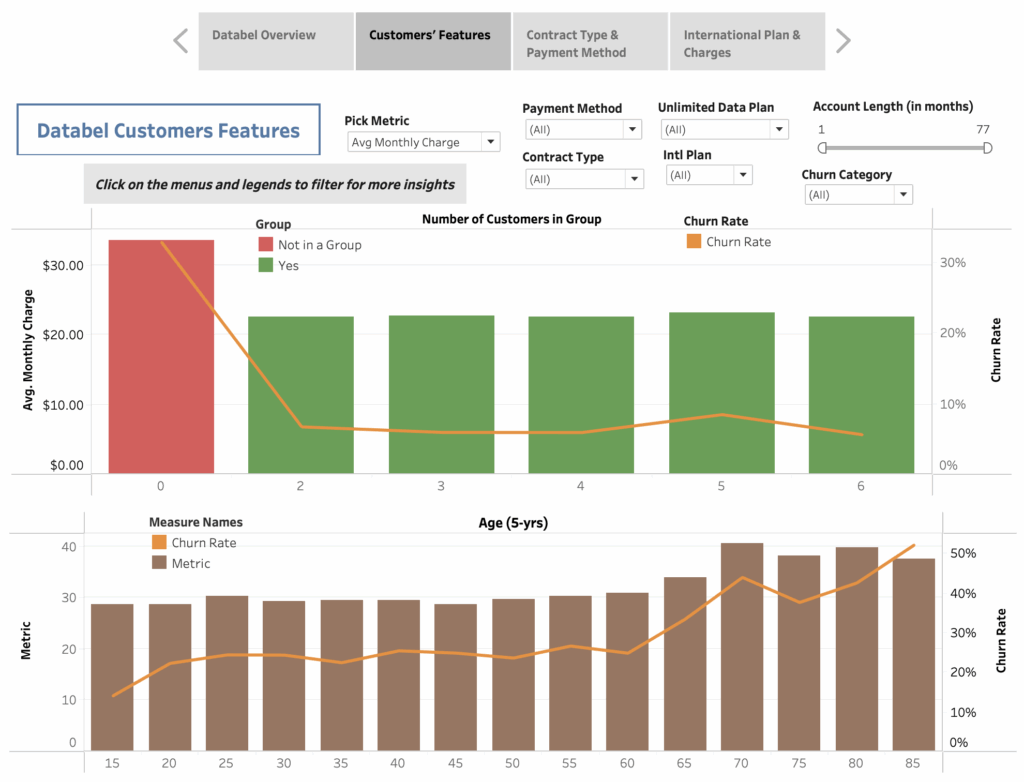
Group Contract & Churn Rates
- The majority of Databel customers are not part of a group contract, despite group contracts typically offering advantages and lower pricing.
- Churn rate for customers not in a group is 33%.
Age Distribution & Churn Rates
- Databel customers represent all age groups, with customers aged 45-50 forming the largest segment.
- However, customers aged 65 and older show the highest churn rates at 41.8% on average.
Key Findings
- Group membership could be a protective factor against churn.
- Age could be a critical factor in customer retention.
Seniors are churning at disproportionately high rates, indicating a need for targeted retention strategies for this demographic, particularly those not enrolled in group contracts.
Contract Type & Payment Method
Contract Type & Churn Patterns
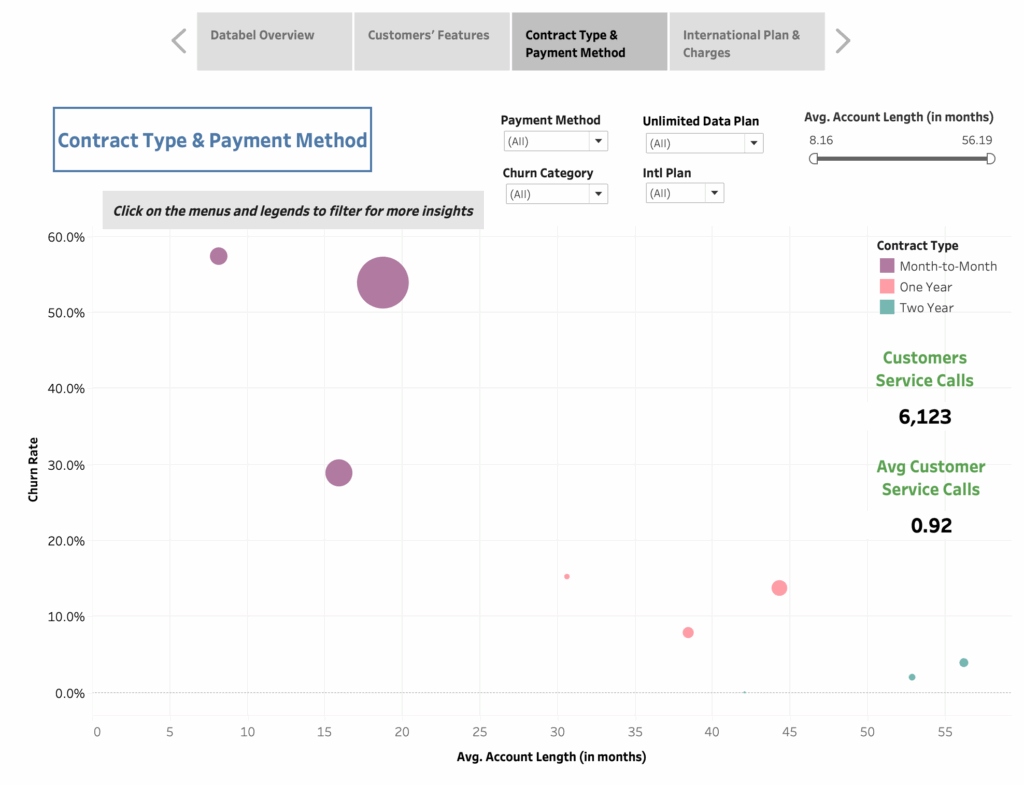
- Month-to-month contracts show the highest churn rate with an average account length of only 18.75 months, followed by one-year contracts, then two-year contracts.
Payment Method & Churn Patterns
- Customers paying with credit card show the lowest churn rate at 29.9%, suggesting payment method influences retention.
Service calls
- Average service calls for month-to-month customers: 1.07 with direct debit/paper check and 0.68 with credit card.
- Customers who churned due to dissatisfaction averaged 2.41 service calls, significantly higher than the company average of 0.92.
Key Findings
- Month-to-month contracts consistently demonstrate the highest churn rates across all metrics.
- Contract commitment level and payment method are both critical factors in customer retention.
- Higher customer service call frequency correlates with higher churn | indicate underlying customer dissatisfaction.
Data & International Plans
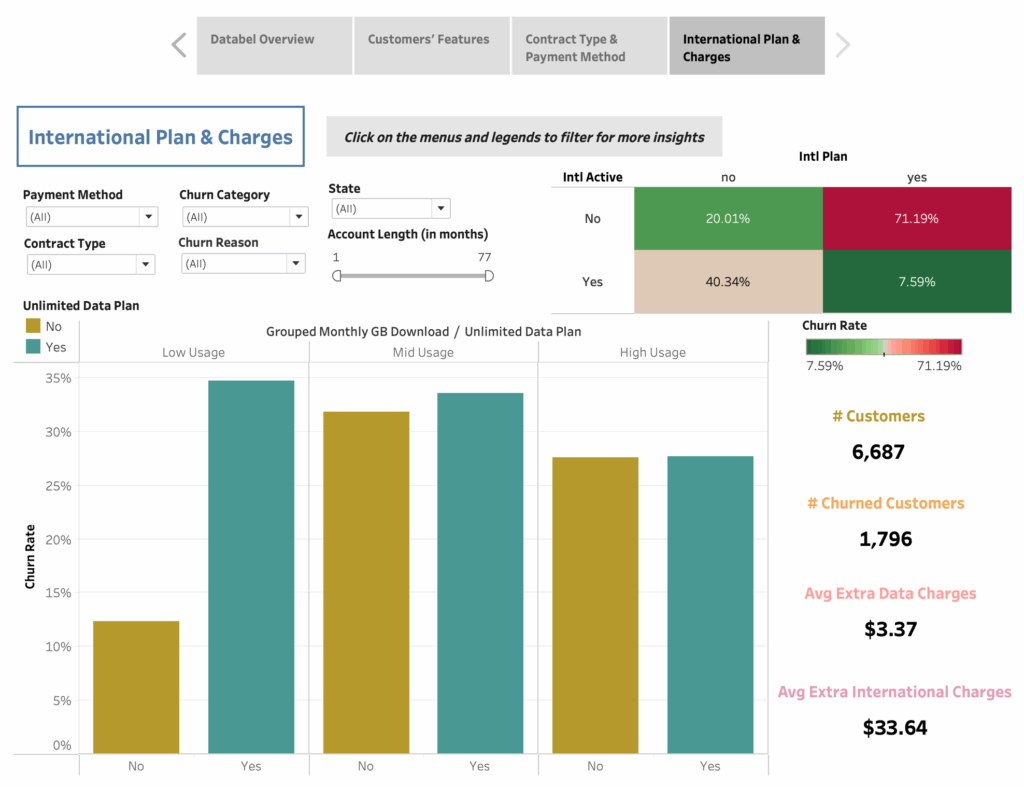
Unlimited Data Plan
Grouped monthly data usage into three categories:
- Low usage: <5GB
- Medium usage: 5-10GB
- High usage: 10+GB
Hypothesis that non-unlimited customers churn more.
- Customers with low usage who have unlimited data plans show the highest churn rate at 34.71%.
International Plan & Activity
- 72.34% of customers have an international plan but are not actively making international calls.
- 50.63% of customers are actively making international calls but do not have an international plan
Plan charges
Low-usage customers with unlimited plans:
- Average extra international charges: $33.75.
- Churn rate: 35%.
Customers are overpaying for unlimited data they don’t need.
High-usage customers without unlimited plans:
- Average extra international charges: $46.75.
- Churn rate: 28%.
Despite higher charges, better plan alignment could reduces churn.
Key Findings
- Customers are either overpaying for data capacity they don’t need or facing unexpected charges, leading to dissatisfaction and higher churn rates.
- Customers tolerate higher costs when their plan matches their needs, suggesting that plan fit matters more than price.
SUMMARY & Recommendation |
- Short-term contracts combined with lack of group membership create high risk for churn risk, dissatisfied customers have no barriers preventing them from leaving.
Prioritize converting month-to-month customers to annual or two-year contracts through targeted incentives (discounts, device upgrades, fee waivers), especially within their first 12 months.
Promote group contract enrollment by identifying individual customers who could benefit from other plans and offering financial incentives for conversion.
These strategies will significantly help reduce churn rates among high-risk customers.
Note: For additional insights and interactive exploration of churn patterns and other factors, please refer to the comprehensive dashboard included in the project deliverables.
Access the interactive analytical dashboard on Tableau for additional data exploration and insights.