Instacart Project
Instacart Sales Analysis

Business Context
Instacart, a leading app-based online grocery store, sought to gain deeper insights into its sales patterns to optimize operations and marketing strategies. This analysis explores customer behavior, purchasing patterns, and demographic trends to provide actionable recommendations.
Objective
Conduct comprehensive data exploration and analysis to uncover insights and recommend strategies for improved customer segmentation and targeted marketing initiatives
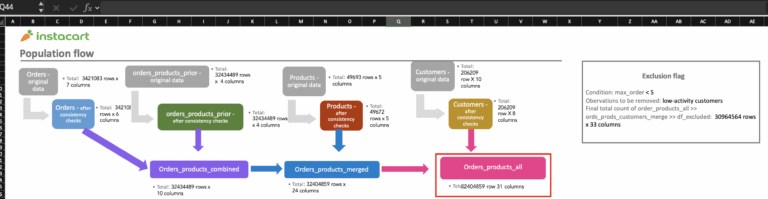
Population Flow
The following population flow diagram illustrates the data processing pipeline used in this analysis:
Orders Dataset
→ 3,421,083 rows
→ 7 columns
Orders Products Prior Dataset
→ 32,434,489 rows
→ 4 columns
Products Dataset
→ 49,693 rows
→ 4 columns
Customers Dataset
→ 206,209 rows
→ 10 columns
Data Merging Process
orders + orders_products_prior → order_products_combined → + products → orders_products_mergred → + customers → orders_products_all
Exclusion flag:
→ max_order ≤ 5
→ Observations to be removed: low activity customers
→ Total rows is 30M after exclusion
→ Exclusion not applied for all analysis to maintain sample diversity
Population Flow Diagram
Technical Approach
- Python
- Pandas
- Numpy
- Matplotlib
- Seaborn
- Scipy
- Jupyter Notebook
- Excel
Data Sources
Data Processing
Wrangling, merging, and deriving variables
Analysis Methods
Grouping, aggregation, and population flow analysis
Visualization
Python Visualizations and Excel reporting
Analysis & Insights
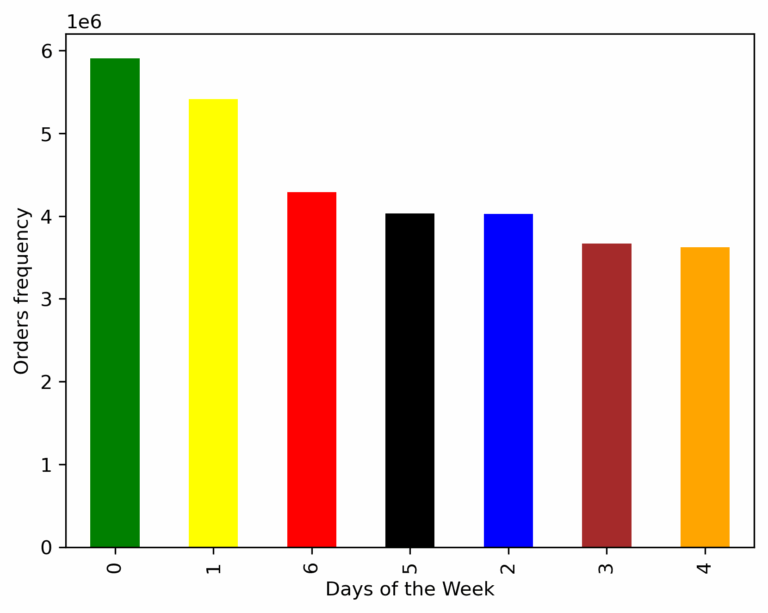
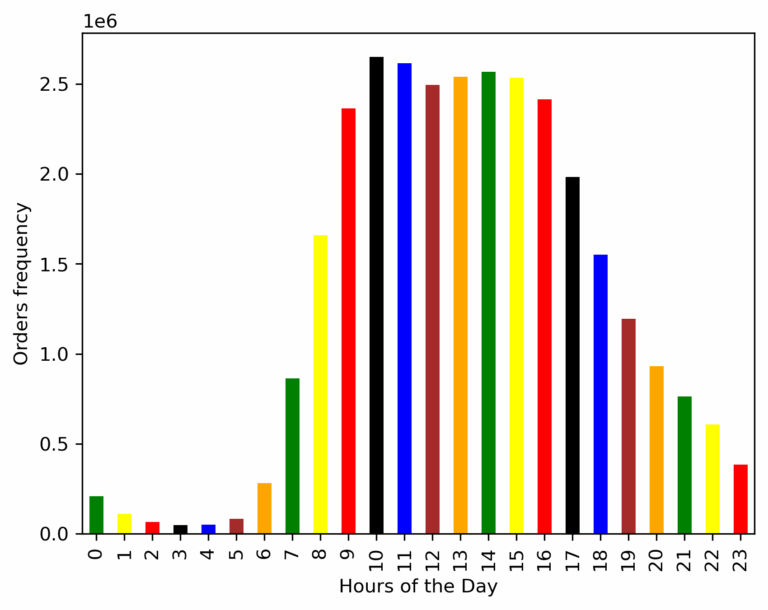
1. Optimal Ad Scheduling: When are customers most active?
Finding: Peak Shopping Times Identified
> Busiest days: Saturdays (0) and Sundays (1)
> Peak hours: 10 AM – 4 PM
> Schedule ads during off-peak hours to maximize visibility when fewer orders compete for attention
2. Spending Patterns: When do customers spend the most?
Finding: Peak Spending Window
> Highest spending occurs from 10 AM to early afternoon
> Aligns with overall peak ordering times
> Opportunity to promote premium products during these high-value time slots
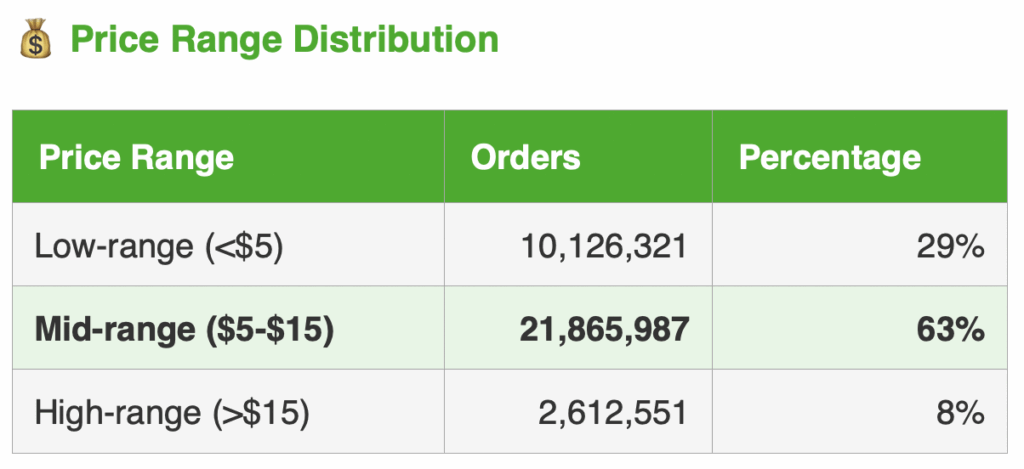
3. Price Segmentation: What price ranges drive the most purchases?
Finding: Mid-Range Products Dominate
> Clear preference for affordable, everyday items
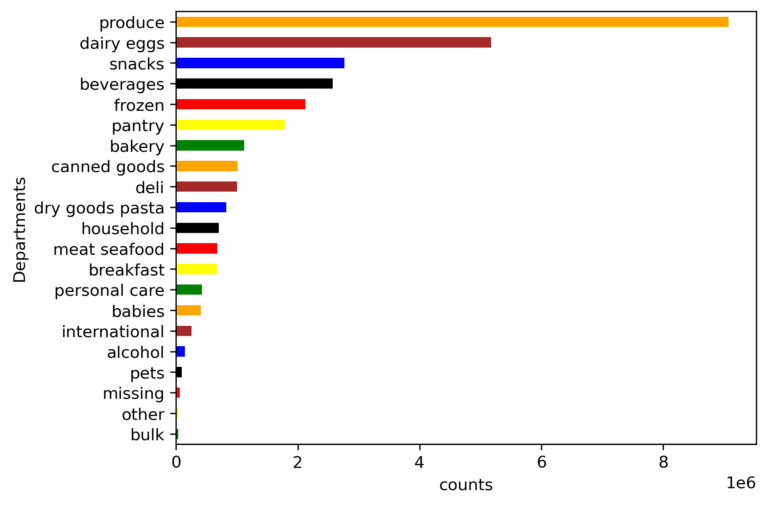
4. Product Popularity: Which departments and products lead in orders?
Finding: Fresh Produce Leads Sales
> Top departments: Produce → Dairy & Eggs → Snacks
> Most ordered item: Bananas (453,164 orders)
> Strong preference for organic products in top 10 items
> Health-conscious shopping behavior evident

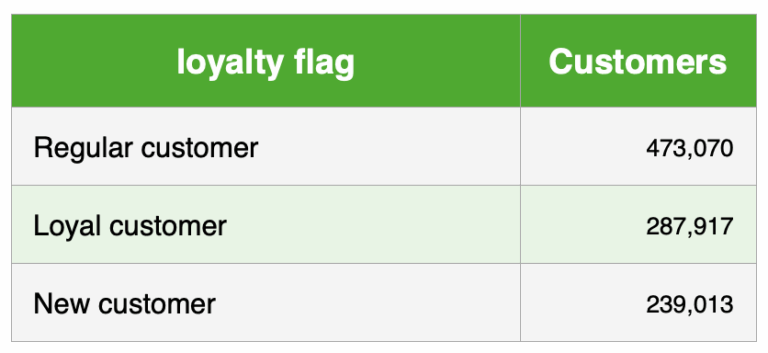
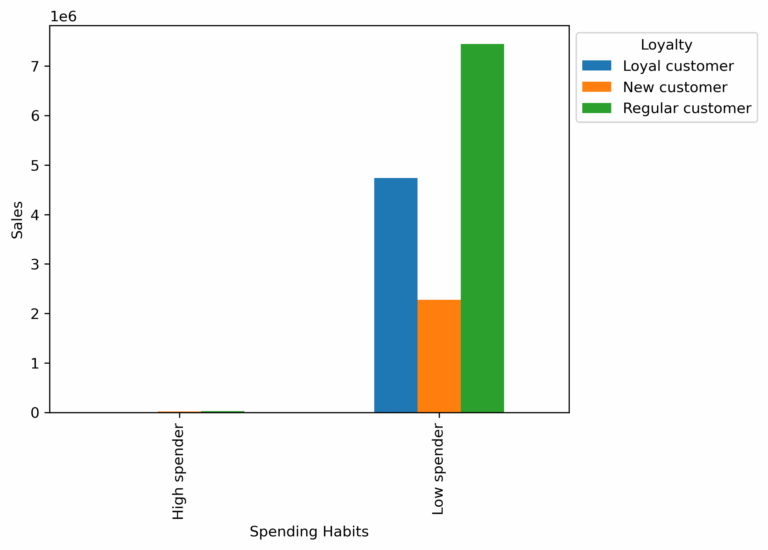
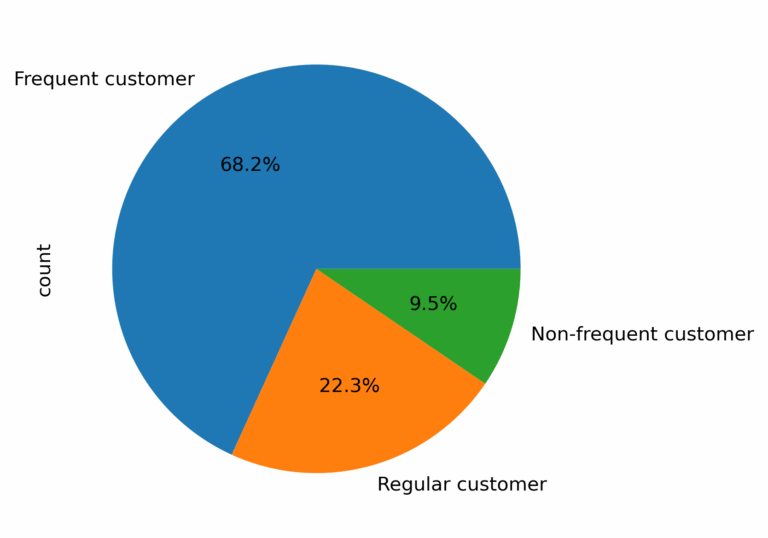
5. Customer Loyalty: How do ordering habits vary by loyalty status?
Finding: Regular Customers Drive Volume
> Regular customers: > 10 && ≤ 40 orders/customer
> Loyal customers: > 40 orders/customer
> New customers: ≤ 10 orders/customer
> Key insight: Regular customer, low-spenders are the core customer base
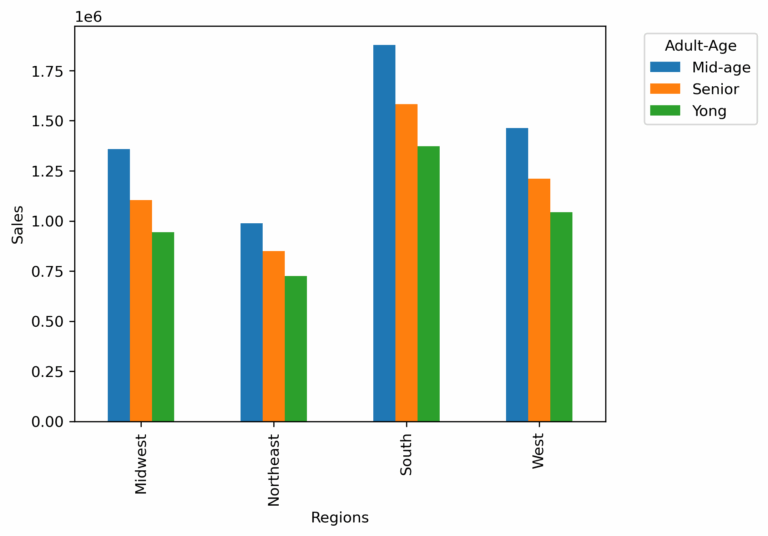
6. Demographic Patterns: How do customer characteristics influence shopping?
Finding: Regional and Demographic Trends
> Top region: Southern
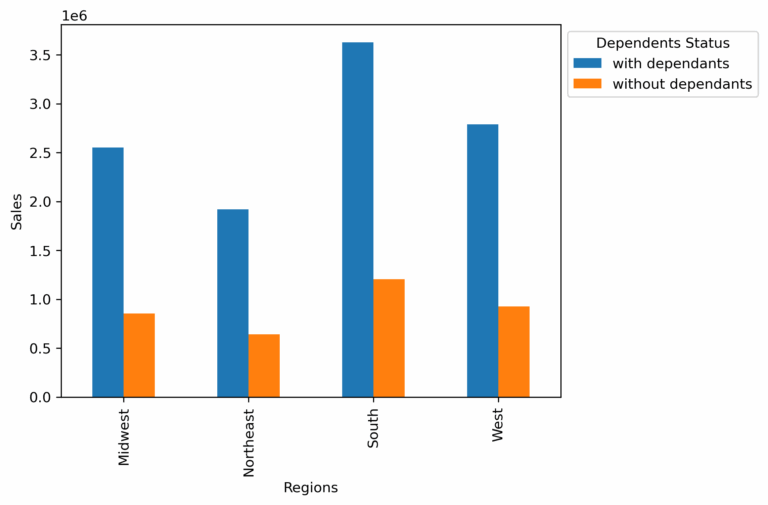
> Primary Customer Profile: Southern Middle-aged customers with dependents
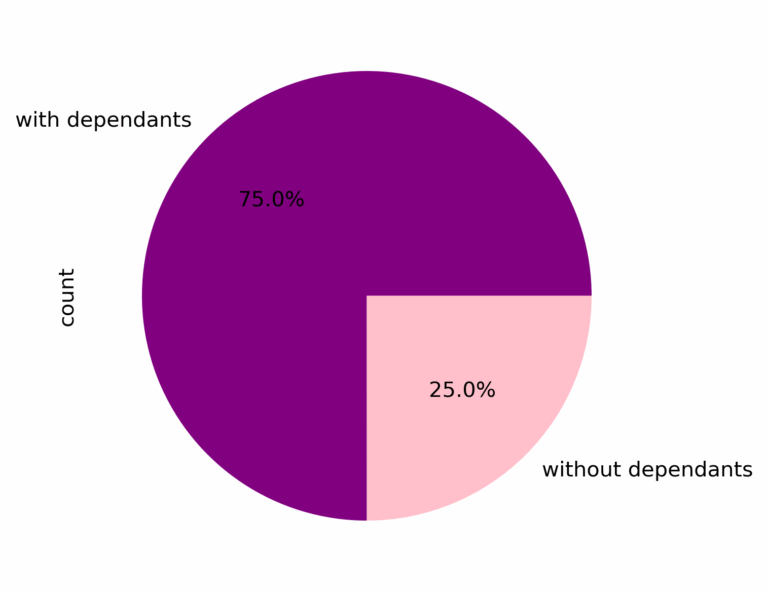
> 75% of orders come from customers with dependents (data not shown)
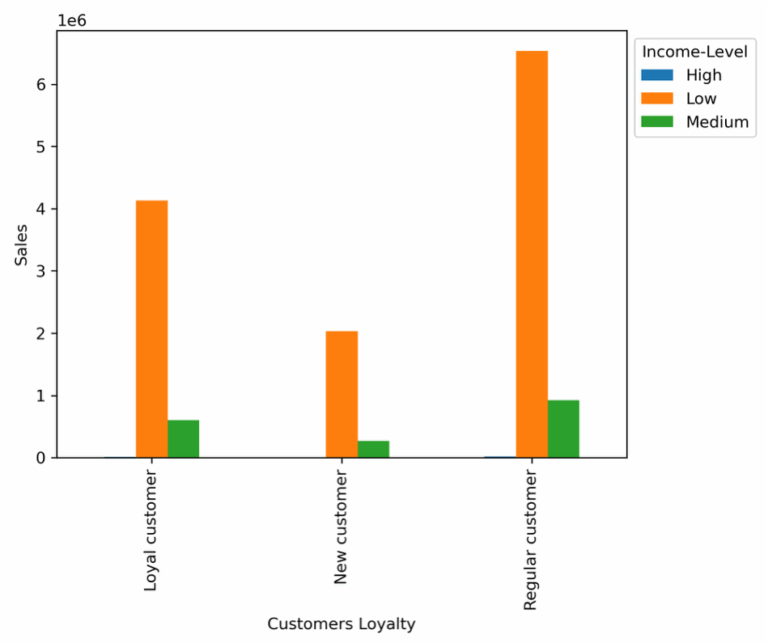
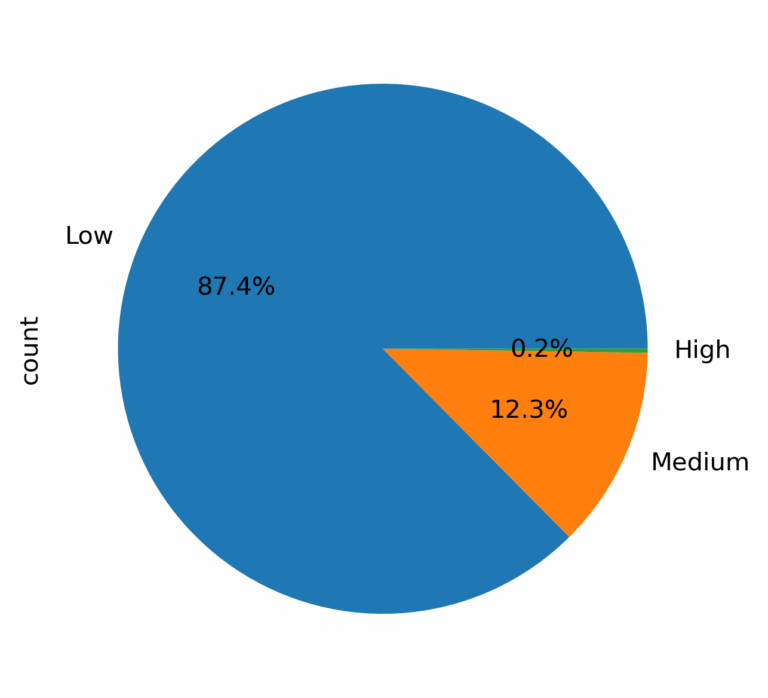
> Low-income customers drive 87.4% of sale transactions across all departments
7. Customer Profiles: What are the ordering habits of different segments?
Finding: Family Status Drives Behavior
The highest number of orders are placed by:
> Frequent customers
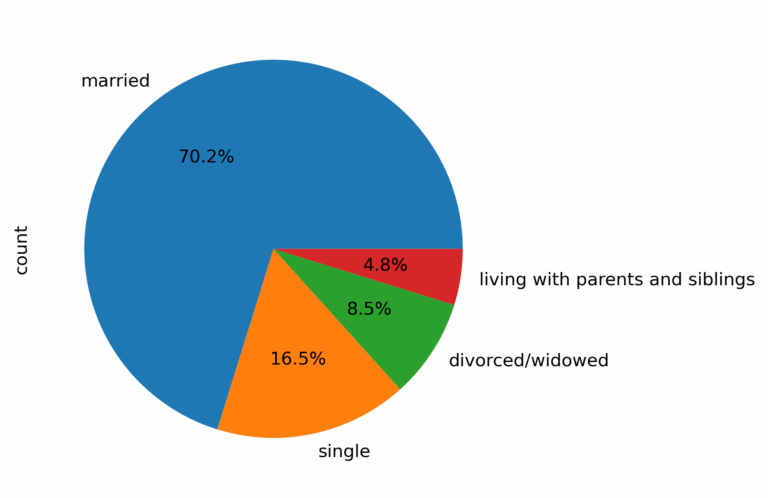
> Married customers
> Customers with dependents
Impact Summary
10AM-4PM
Peak shopping window
87.4%
Orders from low-income segment
70.2%
Orders from married customers
$5-$15
Sweet spot price range
Strategic Recommendations
1. Optimize Ad Scheduling & Budget Allocation
> Schedule promotional campaigns during weekday mornings and evenings when competition for attention is lower
> Reserve premium ad slots for Saturday and Sunday mornings (9-11 AM) to capture pre-shopping attention
> Implement dynamic pricing strategies with slight discounts during off-peak hours to balance order volume
2. Targeted Product Promotion Strategy
> Feature mid-range products ($5-$15) prominently in marketing materials as they drive volume
> Create “Family Value Bundles” combining popular produce items (bananas, organic vegetables) with dairy essentials
> Develop organic product highlights given the strong preference shown in top-ordered items
> Cross-sell snacks and beverages with produce orders through intelligent recommendations
3. Customer Segmentation & Personalization
> Create “Family Essentials” subscription programs targeting married customers with dependents
> Develop budget-friendly meal planning tools for the dominant low-income segment
> Design loyalty progression programs to convert regular customers (10-40 orders) into loyal customers (> 40 orders)
4. Regional Marketing Focus
> Allocate 40% of marketing budget to Southern and Midwestern regions where sales are highest
> Partner with local Southern and Midwestern brands to increase regional relevance
> Develop region-specific promotions that align with local shopping preferences and cultural events
> Test expansion strategies in Western regions where dependent-based households show promise
5. New Customer Acquisition
> Create “First Family Shop” promotions targeting recently married couples and new parents
> Implement referral programs leveraging the large regular customer base
> Develop simplified onboarding focusing on popular items (produce, dairy) to reduce choice paralysis
> Offer incentives for new customers to reach 10+ orders and enter the regular customer segment
Project Impact
> This analysis provided Instacart with actionable insights into customer behavior, purchasing patterns, and demographic trends.
> By understanding that their core customer base consists of budget-conscious families shopping primarily for fresh produce and everyday essentials, Instacart can optimize their marketing spend, improve customer targeting, and enhance the shopping experience for their most valuable segments.
> The data-driven recommendations focus on leveraging existing strengths (high-volume regular customers, popular product categories) while identifying growth opportunities (converting regular to loyal customers, expanding in promising regions).
> This strategic approach ensures marketing efforts align with actual customer behavior rather than assumptions.
Deliverables
> Population Flow & Excel Report can be found here
> Codes, additional Visualizations & Insights can be found here