Satellite Project
An Insight into Satellites

PROBLEM |
The relationships between satellite characteristics, such as capacity, functionality, launch mass, and expected lifetime remain unclear. This lack of clarity makes it difficult to identify patterns and reliably forecast future industry trends. The relationships between satellite characteristics, such as capacity, functionality, launch mass, and expected lifetime remain unclear. This lack of clarity makes it difficult to identify patterns and reliably forecast future industry trends.

GOAL |
The aim is to understand the satellite industry by identifying key country players and exploring the complex relationship between satellite launch mass and expected lifetime. This analysis seeks to provide actionable insights that can drive innovation and guide industry stakeholders.

Role |
Data Analyst
Project Scale |
January 25th – February 18th (25 days)
Primary Stakeholder |
CareefFoundary Tutor and Mentor | Data Analytics Immersion Course
Tools Used |
♣ Python libraries: pandas, numpy, sklearn- scikit-learn, quandl (API)
♣ Python visualisions libraries: matplotlib, seabron, folium
♣ Tableau
♣ Github
Who is it for?
The client is a startup company, Celestial Innovatech, interested in learning about the satellite industry.
When will it be used?
The data will inform the company’s innovation plan and strategy development. The company aims to leverage these insights to make informed decisions about building lightweight, long-lasting satellites that demonstrate resilience in low Earth orbit (LEO) classes.
Why is it being built?
The clients aim to understand the market to drive innovation in the LEO orbit. Their new technology seeks to develop satellites maintains high capacity, with reduced launch mass and increased longevity.
What will it consist of?
The storyboard will provide information about satellites in the LEO orbit, focusing on their launch mass and expected lifetime.
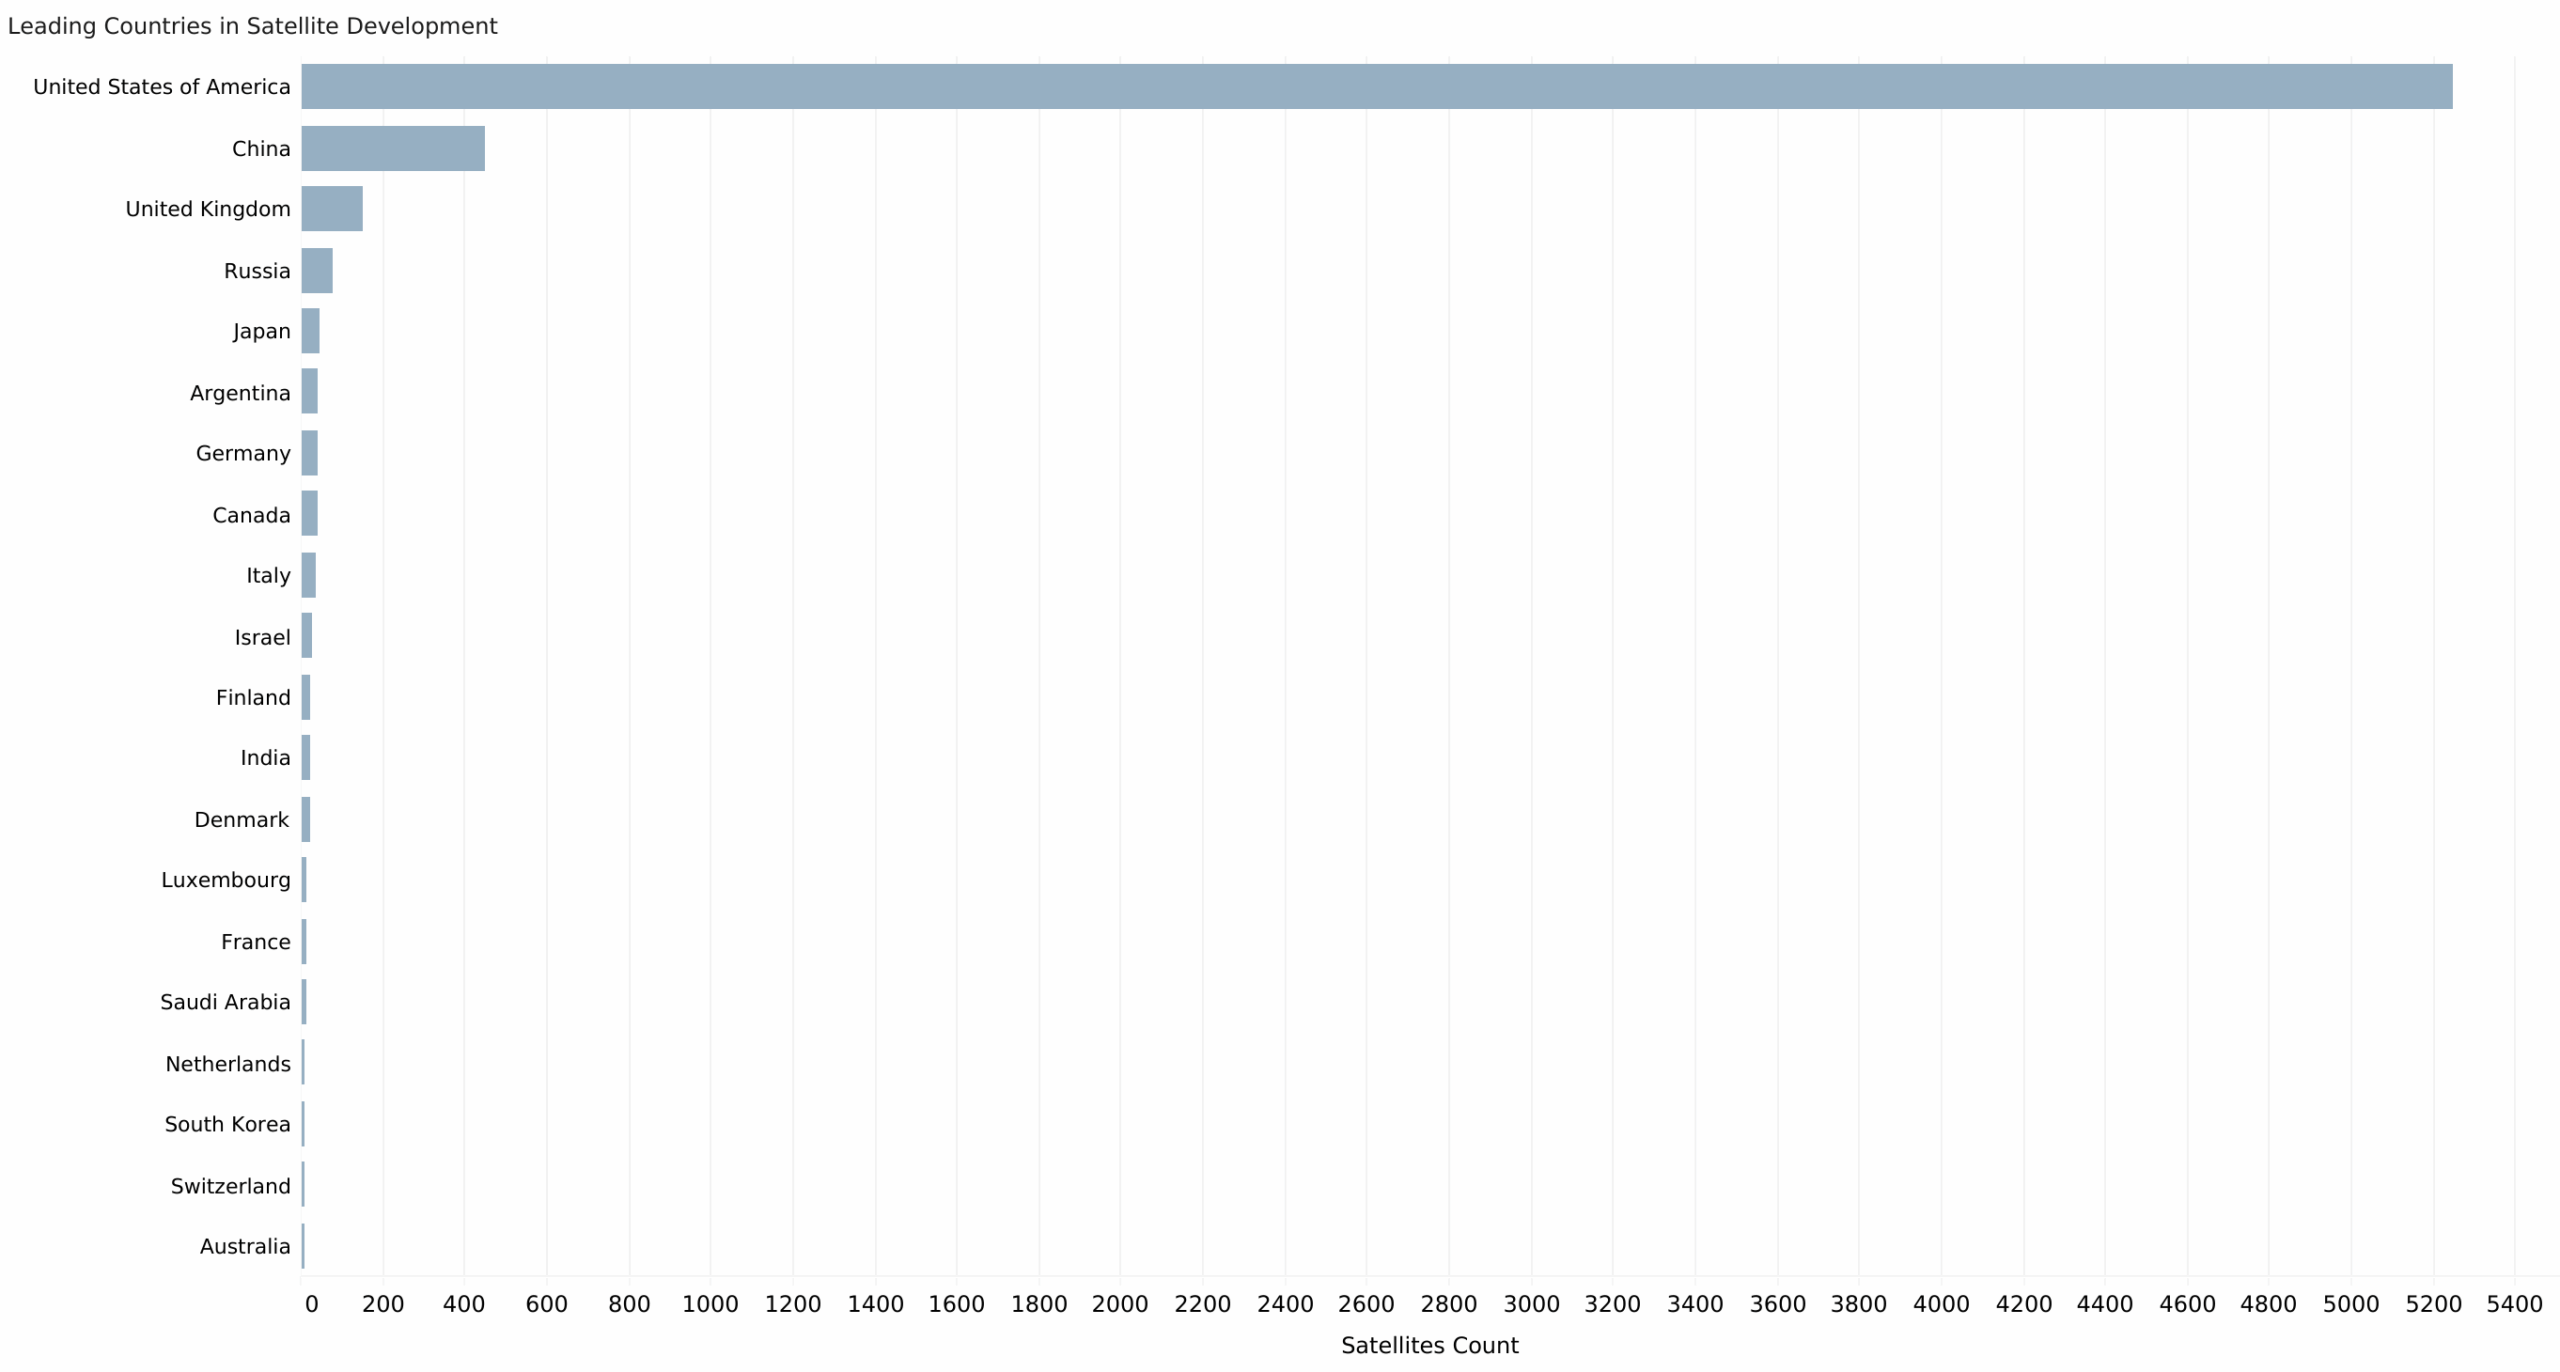
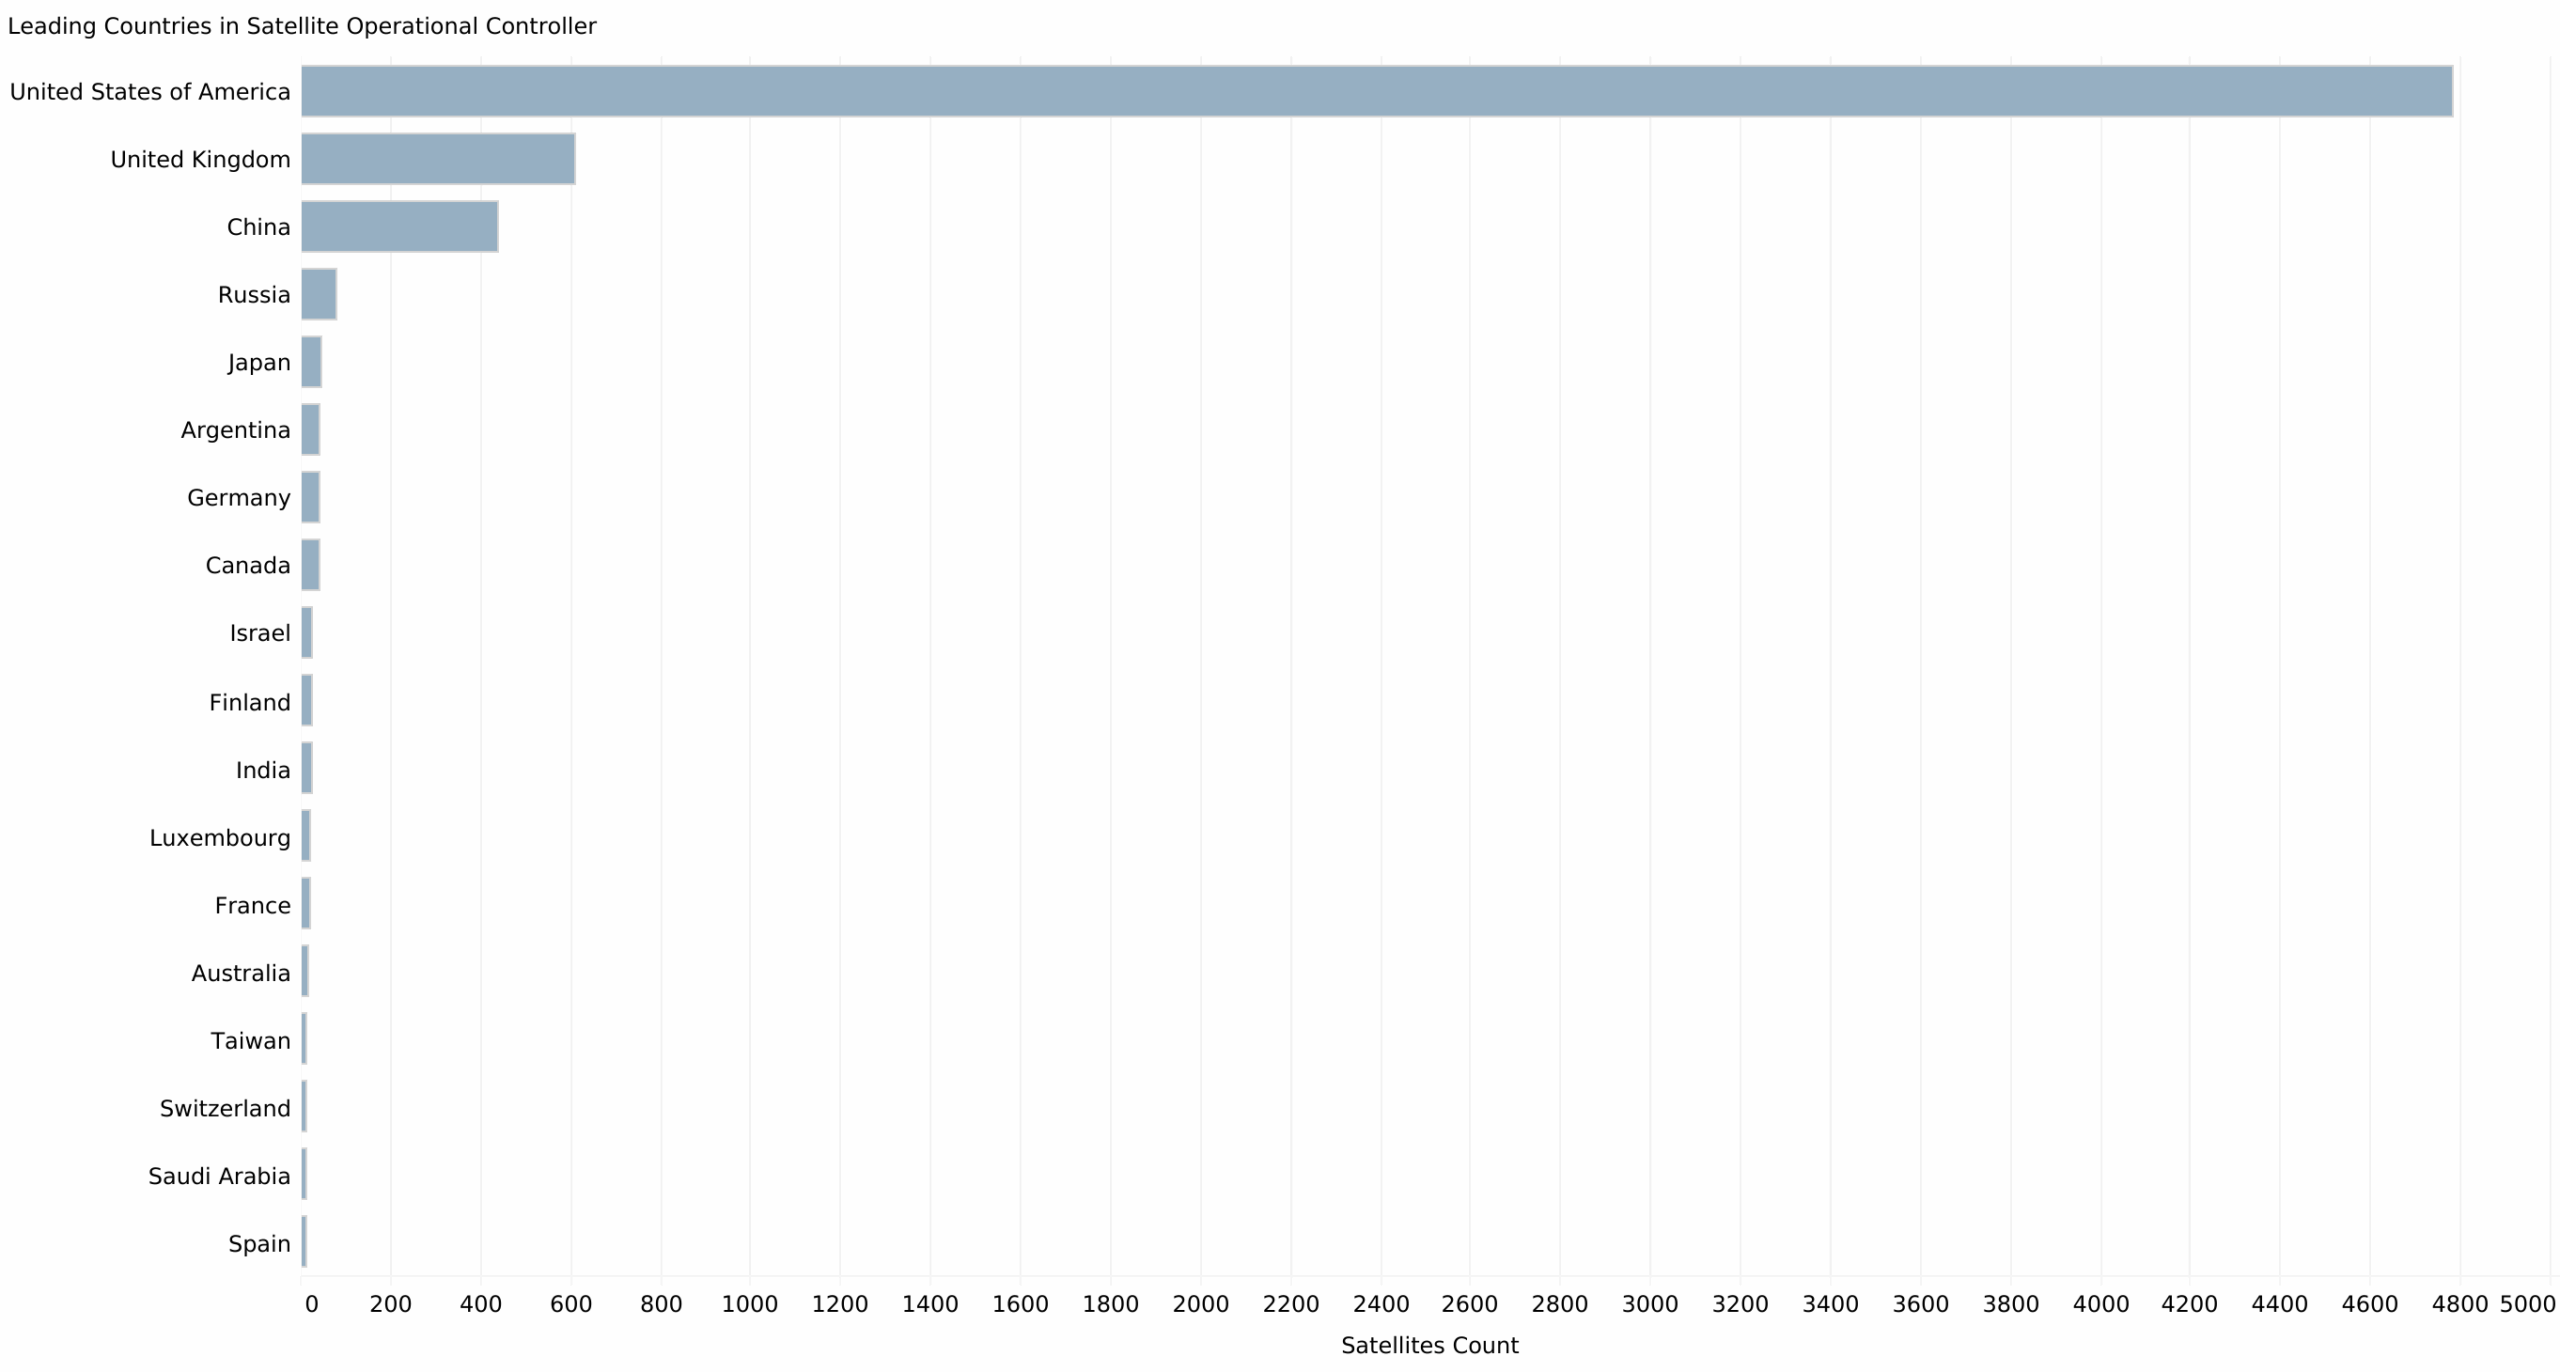
The leading country in the satellite industry is the United States of America by far, followed by China, the United Kingdom, and Russia, with other countries following subsequently.
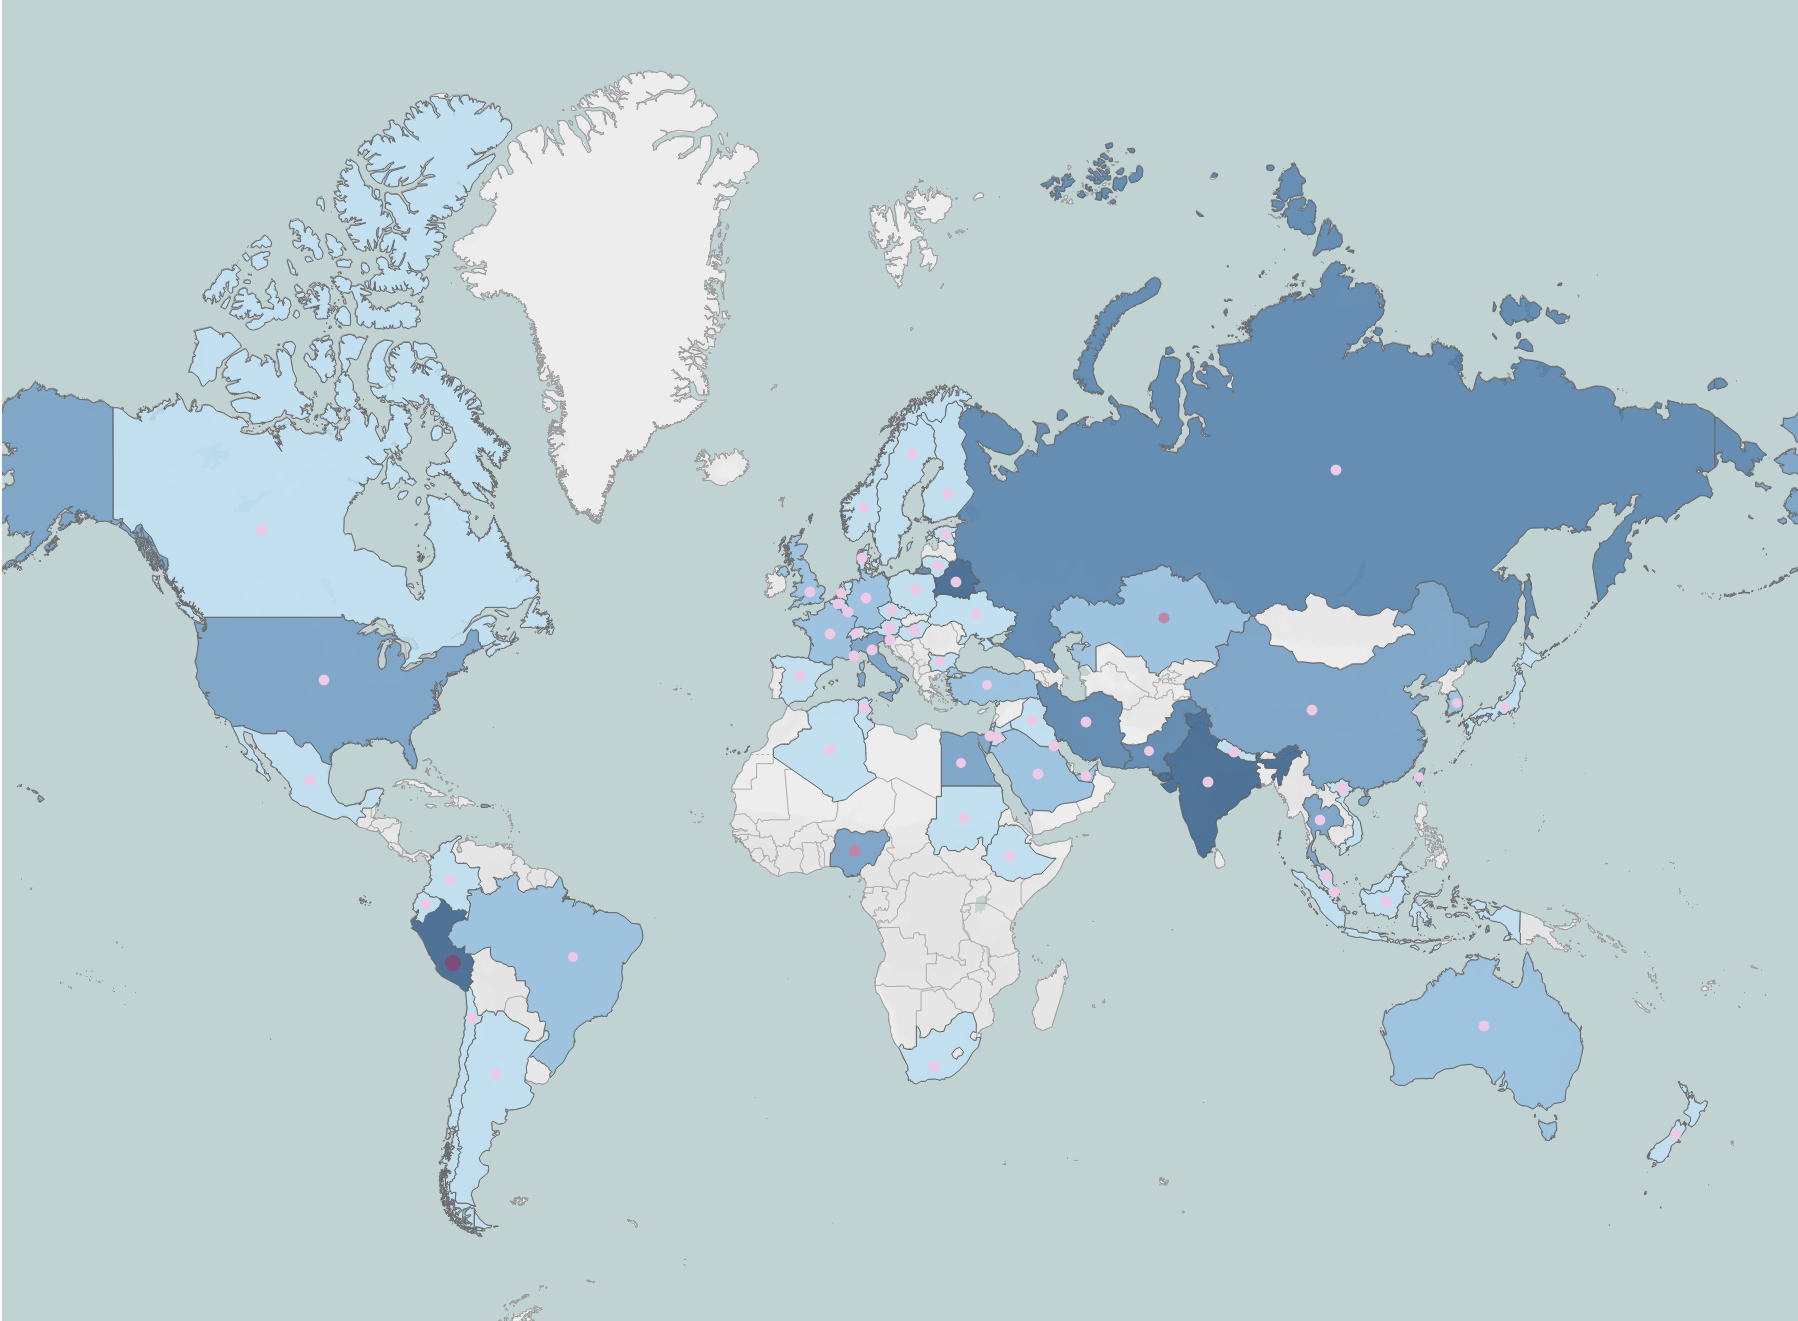
GeoSpatial Analysis |
- The world map illustrates the average launch mass of satellites by country. These countries either own or operate the satellites.
- A lighter shade of blue indicates a lighter average launch mass, while a darker shade signifies a heavier average launch mass.
- Notably, the United States, Russia, and China, among other countries, have a medium average launch mass launch mass for their satellites.
- On the other hand, countries such as India, Iran, Peru, and Poland tend to have satellites with a heavier average launch mass.
- The colored dots on the world map represent the average expected lifetime of satellites based on the country of the satellite contractor.
- Light, medium, and dark purple dots indicate short, medium, and long average expected lifetimes lifetimes, respectively.
- Observing the map, it’s clear that most countries constructing satellites typically produce those with a short average expected lifetime.
- However, Kazakhstan and Peru are exceptions, as they build satellites with medium to long expected lifetimes, averaging 5 to 10 years, respectively.
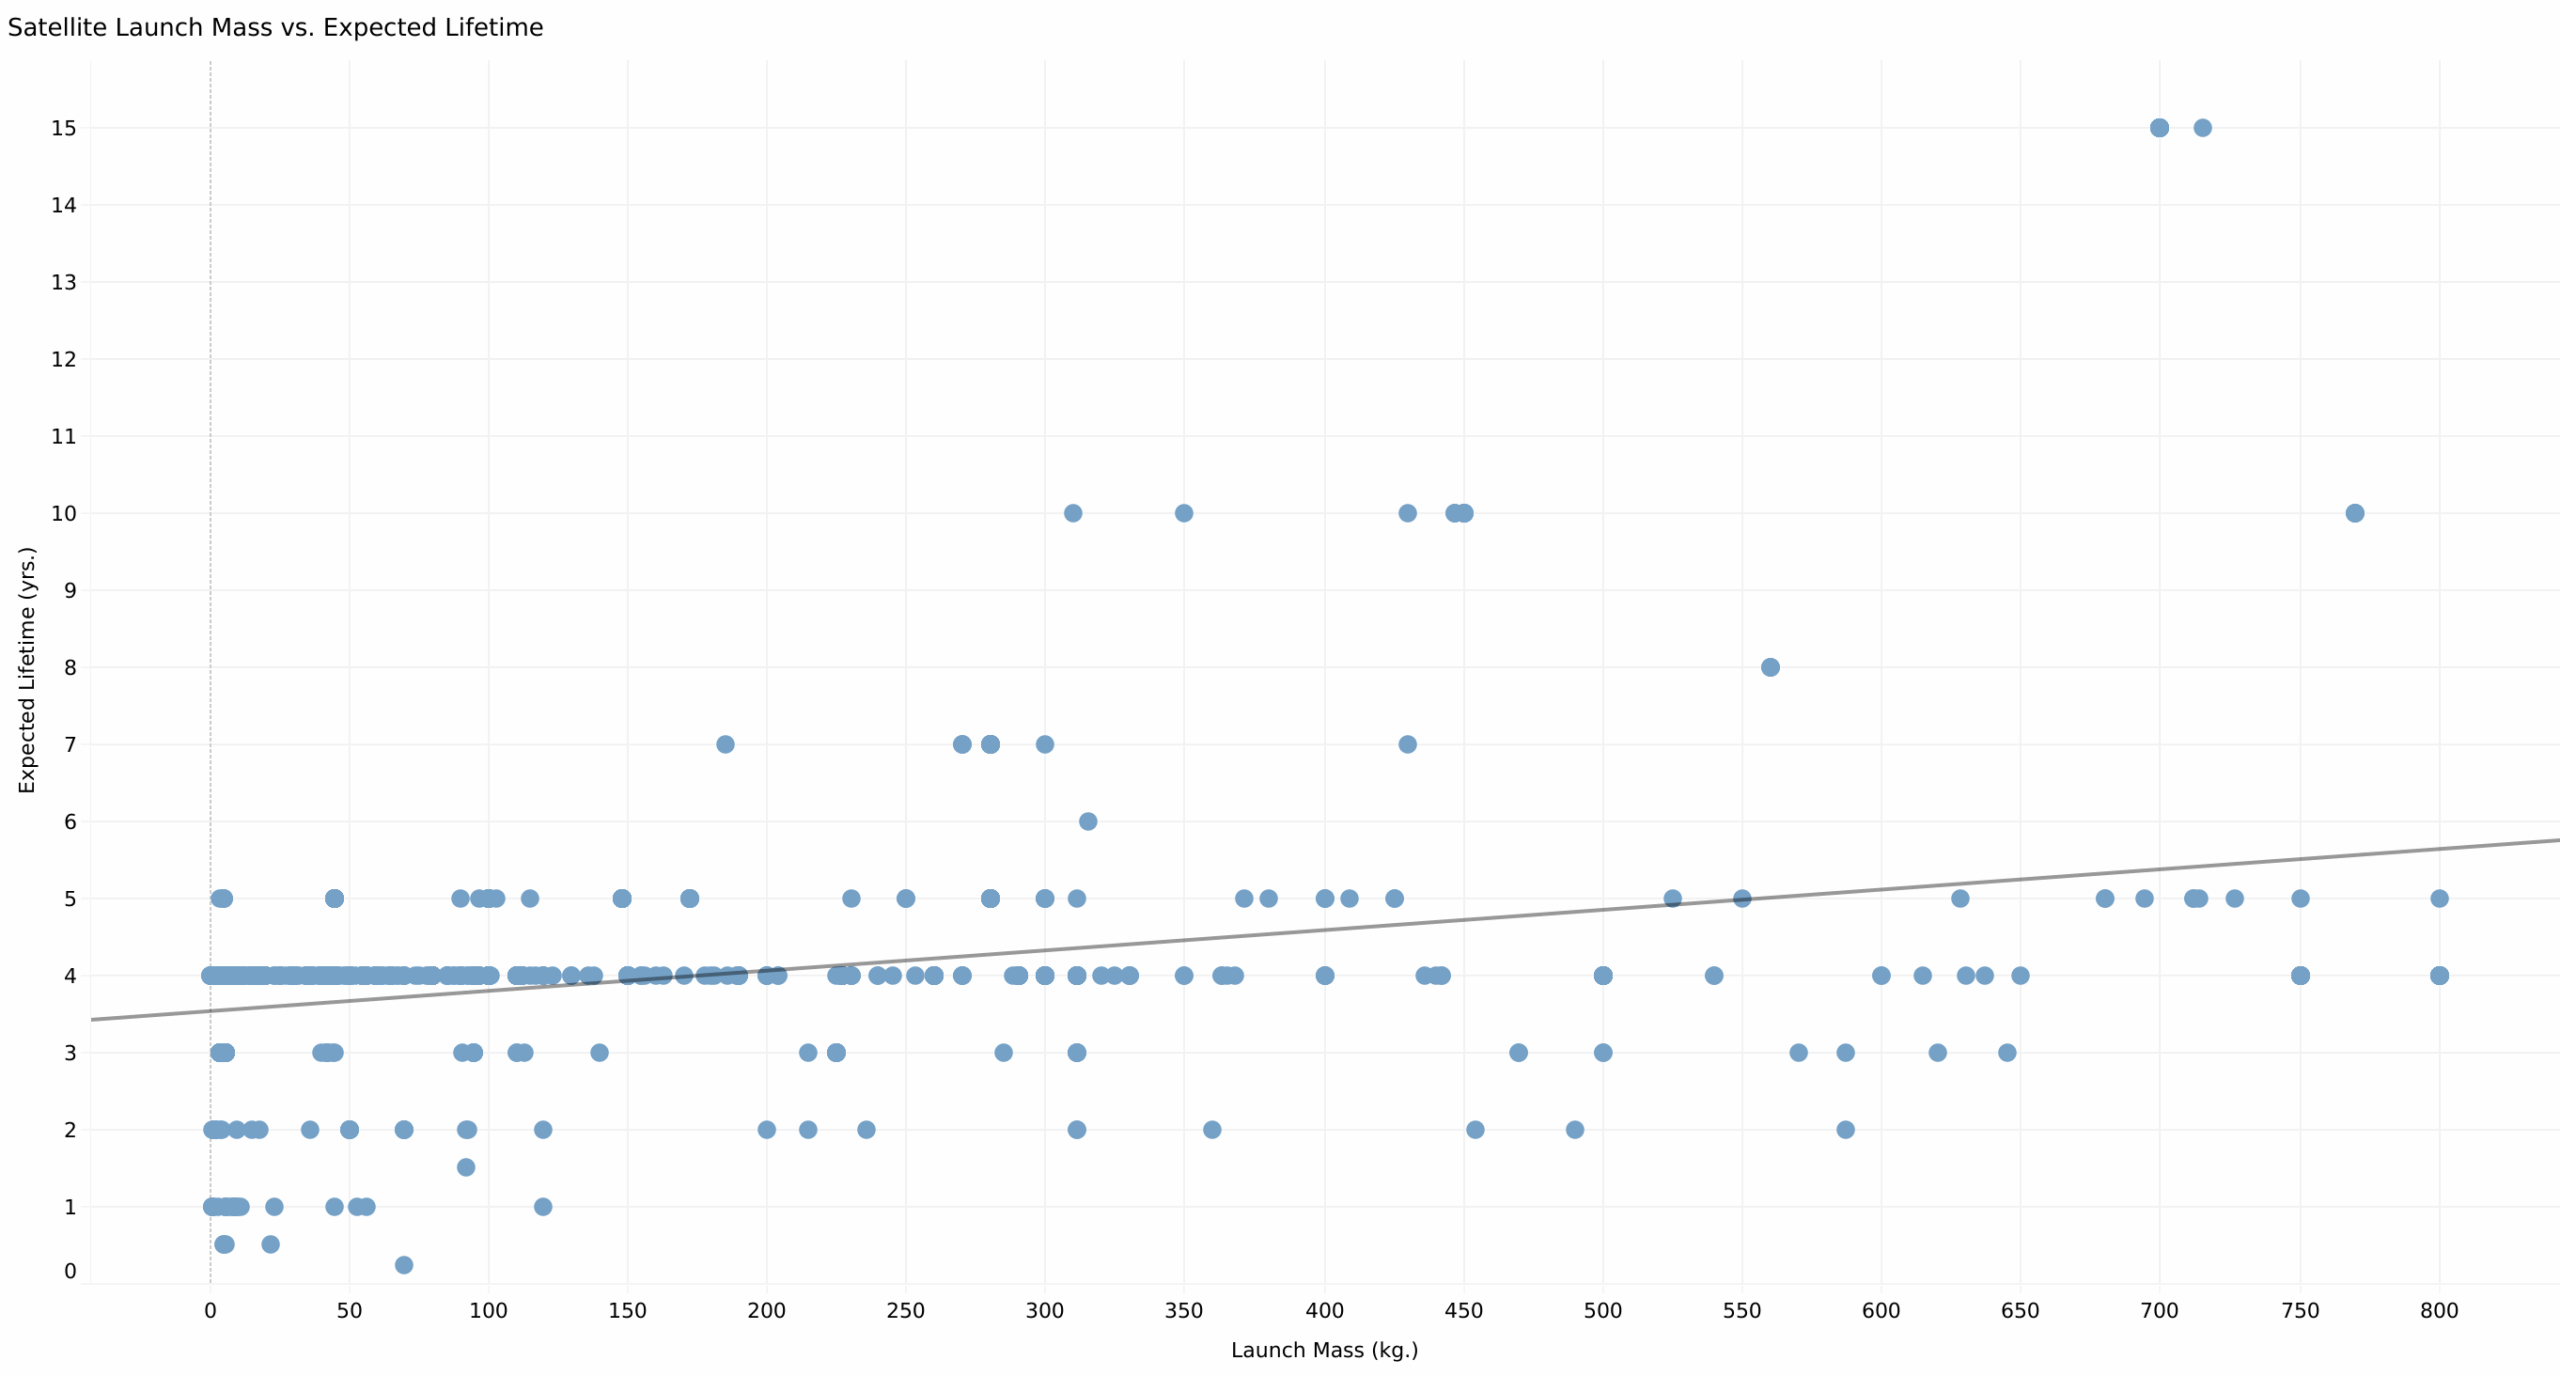
Exploratory & Regression Analysis |
I wanted to investigate whether the satellite launch mass determines the satellite’s expected lifetime.
Exploratory Analysis |
- During the exploratory analysis, the scatterplot revealed a strong positive correlation between these two variables.
- However, some outlier values in the data might have influenced this correlation.
Regression Analysis |
♣ I further investigated this relationship by applying regression analysis. The line of best fit on the plot indicates a slight positive correlation between satellite launch mass and expected lifetime.
♣ However, the gray regression line of the linear model does not perfectly fit all the data points on the plot. In fact, when zoomed in, the line appears almost horizontal, suggesting a minimal relationship between the two variables.
♣ For many data points with a light launch mass (less than 300 kg), there are instances of both short and long expected lifetimes.
♣ Similarly, for a heavy launch mass (more than 700 kg), instances of both short and long expected lifetimes are observed.
♣ Further, I evaluated the performance of the model I evaluated the performance of the model I evaluated the performance of the model I evaluated the performance of the model:
- The slope shows a coefficient of 0, indicating that changes in launch mass do not affect the expected lifetime.
- The mean squared error suggests that the regression line closely aligns with the observations, initially indicating that the regression model might be a good fit. However, when the variance in the data was accounted for using the R² value, it suggested that the model is a poor fit for these values, implying that it does not explain the variability in the data well.
Interpretation |
- Although the dataset (LEO Satellite count: 6404) contains a substantial number of data points that could potentially support a well-fitting model, this outcome was not observed.
- The lack of a strong linear relationship might be due to other factors or variables influencing the primary variables of interest.
- It may also indicate that the relationship between launch mass and expected lifetime is independent, with no direct linear connection.
- This suggests that their relationship might be non-linear, implying that the observed correlation may not fully capture the complexity of their interaction, if any.
- Additionally, LEO satellites require less fuel to initially reach orbit; however, they may need more fuel for orbital maintenance due to the frequent adjustments necessary to counteract atmospheric drag.
Time Series Analysis |
- The X-axis represents the years from 1998 to 2023.
- In line chart (A), the Y-axis represents the average launch mass (kg).
- In line chart (B), the Y-axis represents the average expected lifetime (years).
- Both charts display noticeable fluctuations, with peaks and drops indicating periods of increase and decrease in both average launch mass and average expected lifetime over the years.
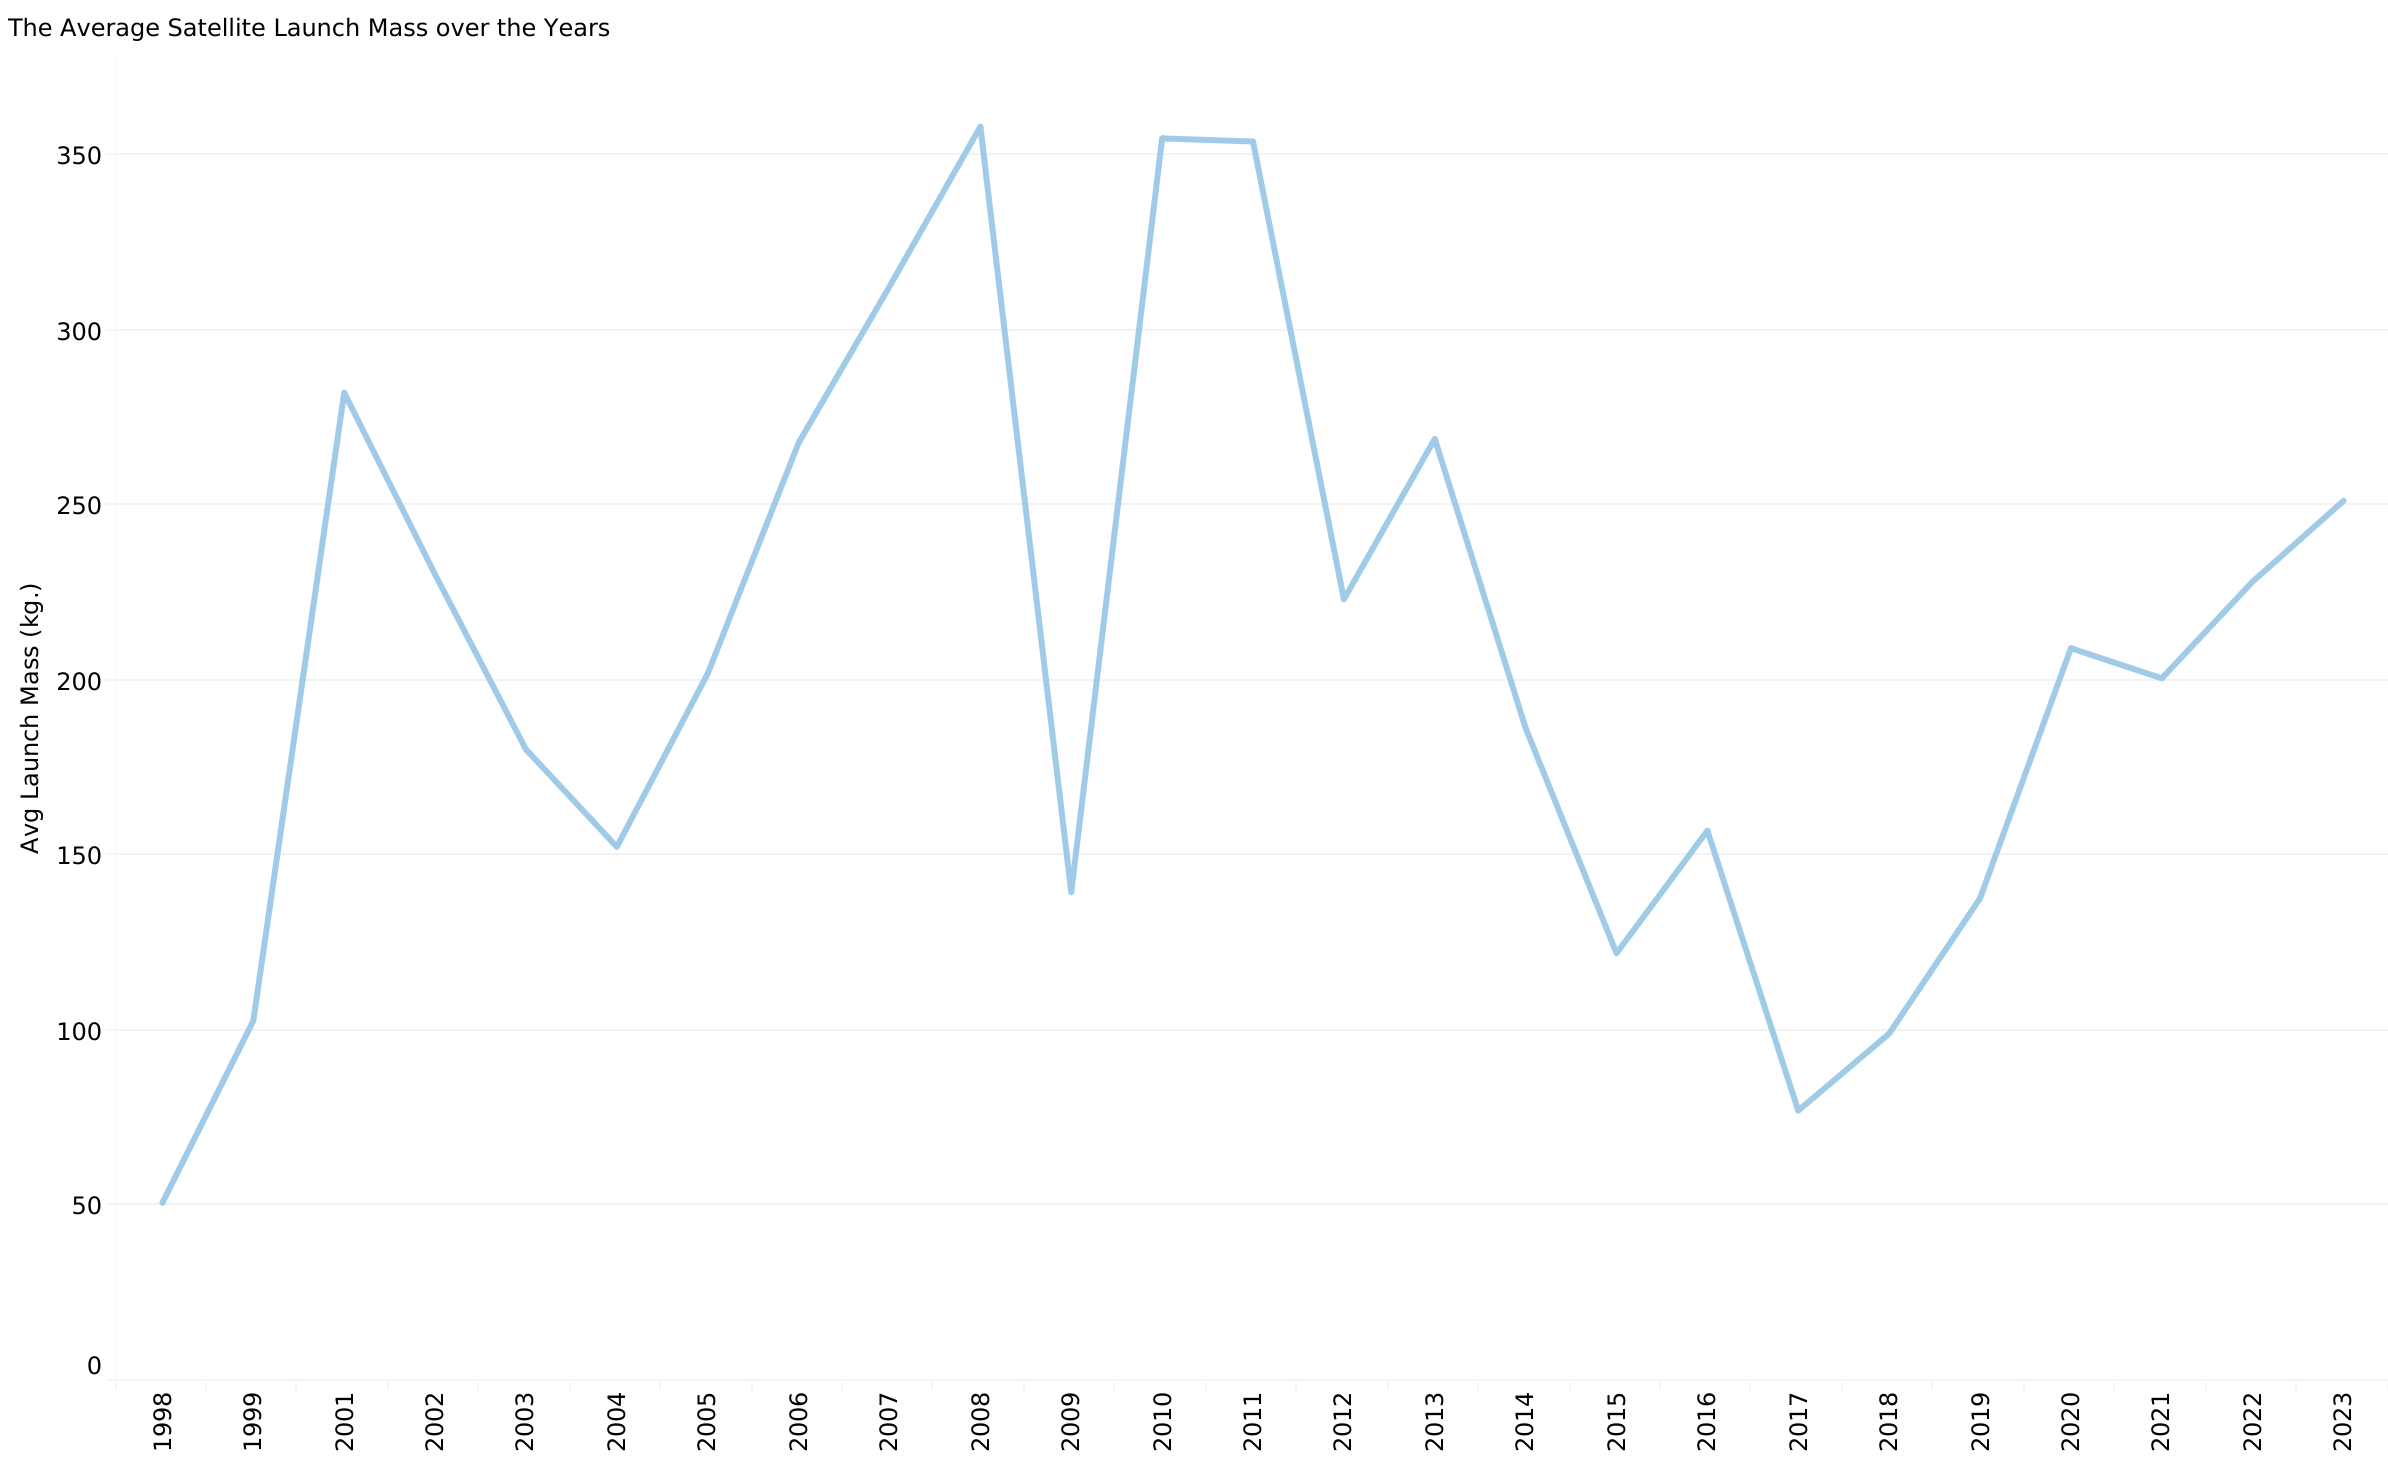
- In 2009, a significant drop in average launch mass was observed.
- Post 2009, there have been fluctuations in the average launch mass, with a continuous upward trend in recent years.
- Significant drops in average expected lifetime occurred in 2001, 2009, and 2012, possibly due to a decrease in satellite launches, perhaps linked to the economic crisis.
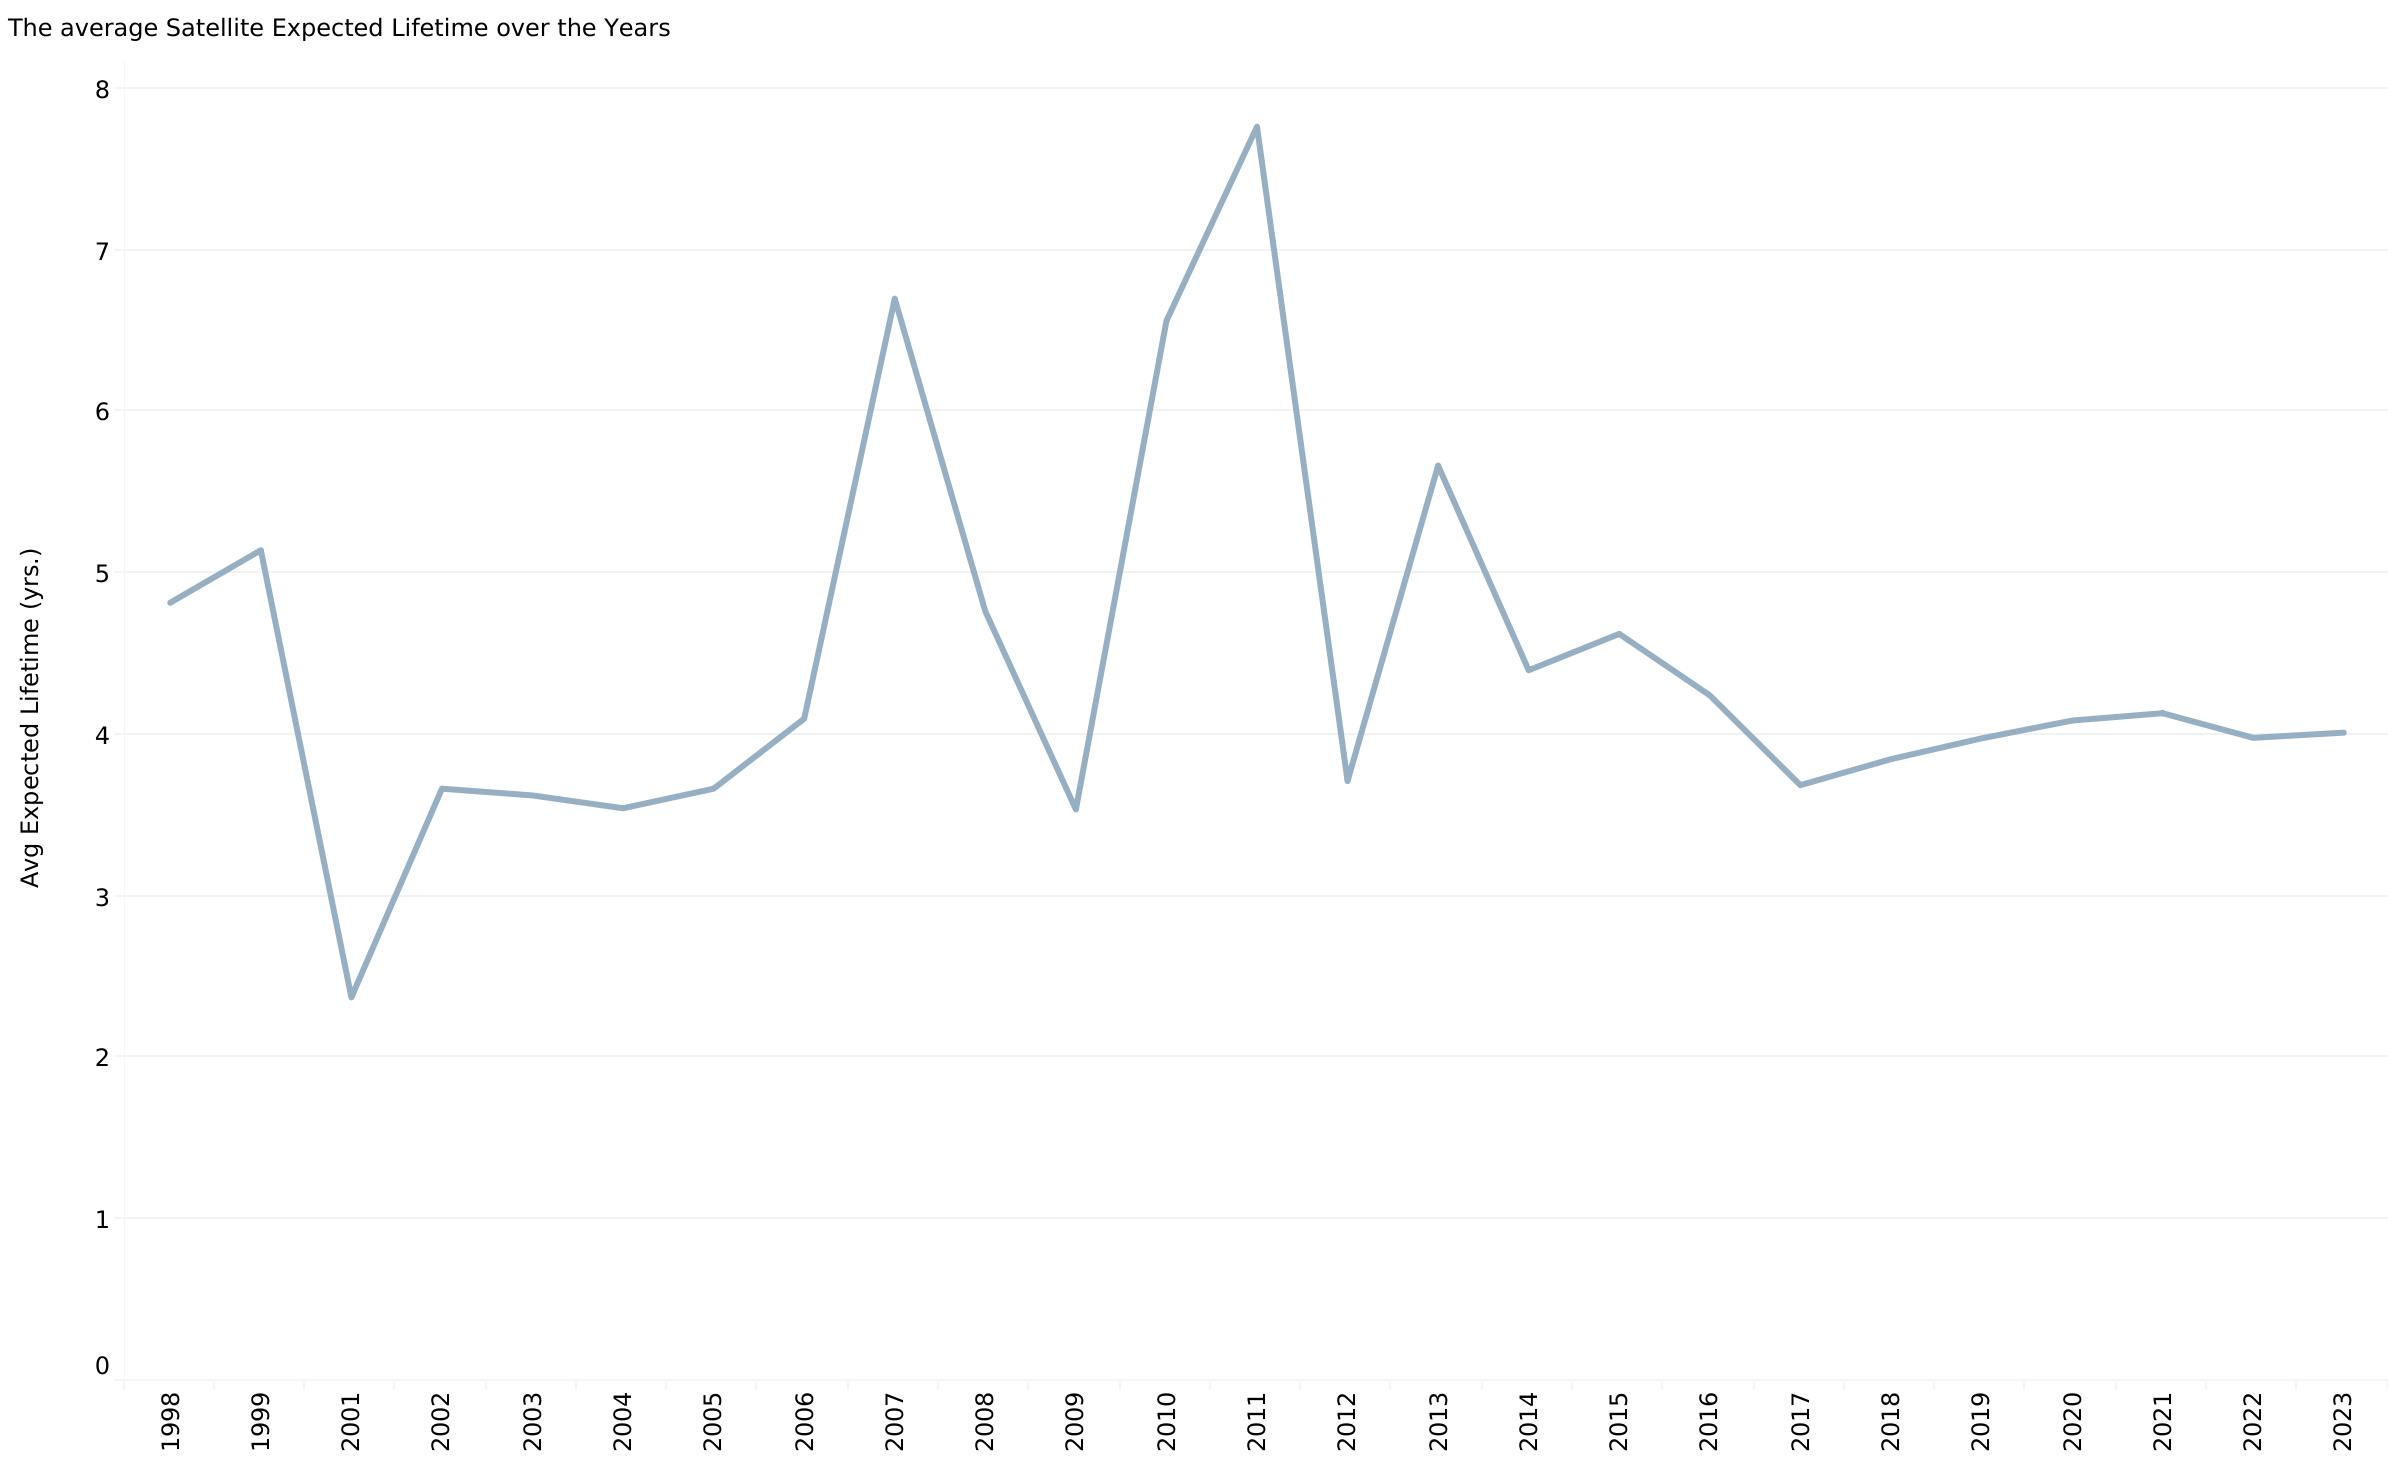
- It’s also possible that the satellite industry experienced underperformance during certain periods, contributing to the decline in expected lifetimes.
- Since 2012, average expected lifetime has fluctuated over the years, but a steady trend has emerged in more recent years.
- The data does not exhibit any seasonality, indicating that the observed trends and variations are not associated with seasonal patterns.
Conclusions & Recommendations |
- The data suggests that there is no linear relationship between launch mass and expected lifetime.
- Most countries, including leading satellite nations, do not typically operate or build satellites with a light launch mass and a long expected lifetime. This may indicate a trade-off between these two variables, potentially influenced by other factors such as satellite capacity and functionality.
- The time series analysis suggests that the data is likely stationary, as confirmed by other statistical tests performed. Therefore, it is recommended to proceed with forecasting using this stationary data, which could help predict trends in launch mass and expected lifetime of satellites in the upcoming years.
- With the majority of data points originating from just a few leading countries, the dataset may be subject to bias. I recommend that future investigations exclude major countries like the United States, Russia, The United Kingdom, and China to explore how the industry appears without their influence.
- Additionally, I suggest that the company carefully consider their targeted customers, as the analysis indicates significant differences among countries in the satellite industry.
- Celestial Innovatech has the potential to introduce groundbreaking technology to the satellite industry. The analysis highlights that characteristics such as high capacity, reduced launch mass, and increased longevity— central to Celestial Innovatech\’s innovation plan and strategy development—are not commonly found in the current satellite industry. This positions them uniquely to make a significant impact.
Future Steps |
- Optimizing the models could lead to improved results, as all models in this analysis were run with default parameters. Fine-tuning these settings may enhance performance.
- Implementing cross-validation would provide a more reliable evaluation of model performance, resulting in more robust and trustworthy outcomes.
Challenges |
♣ This project was both my favorite and my most challenging one so far. I thoroughly enjoyed sourcing the data, exploring it for machine learning and time series analyses, and building geographical visualizations with Python. I quickly became comfortable applying different algorithms to the data. However, interpreting the results of the machine learning models proved to be more difficult and took some time.
♣ Through research and further reading, I concluded that the dataset I worked with might not be ideal for the types of analyses I attempted— specifically machine learning and forecasting—which is often the reality when dealing with real-world data. For example, during the exploratory analysis stage, I observed that the relationships between variables were non-linear. Later, when I fit a linear regression model to the data, the poor fit further confirmed these findings.
♣ I had a productive discussion with my tutor about my results and interpretations, which helped deepen my understanding. Although the data was imperfect and required thoughtful preprocessing and adjustments for effective modeling, I recognize that gaining experience with different datasets will improve my ability to prepare data for such type of analysis.
♣ Ultimately, even though no strong correlations were found and the model did not fit the data well, the analysis was still valuable. These insights are important for stakeholders, serving as a reminder of the challenges and realities of working with real-world datasets.
Project Deliverables |

